Copyright
©The Author(s) 2004.
World J Gastroenterol. Jun 15, 2004; 10(12): 1806-1809
Published online Jun 15, 2004. doi: 10.3748/wjg.v10.i12.1806
Published online Jun 15, 2004. doi: 10.3748/wjg.v10.i12.1806
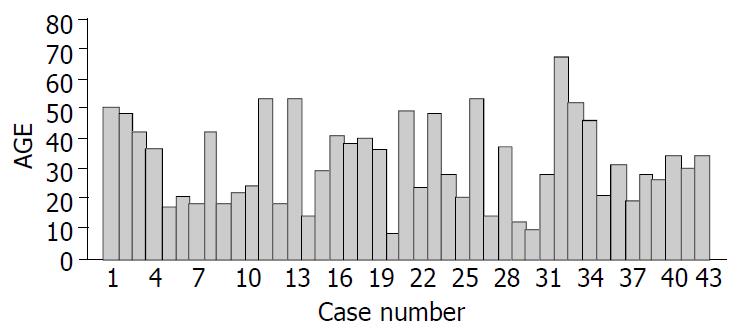
Figure 1 Age distribution in 43 NFICTs patients.
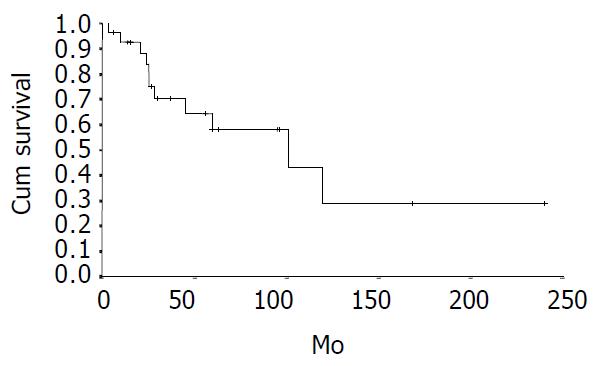
Figure 2 Actual survival for all patients with NFICC (n = 28).
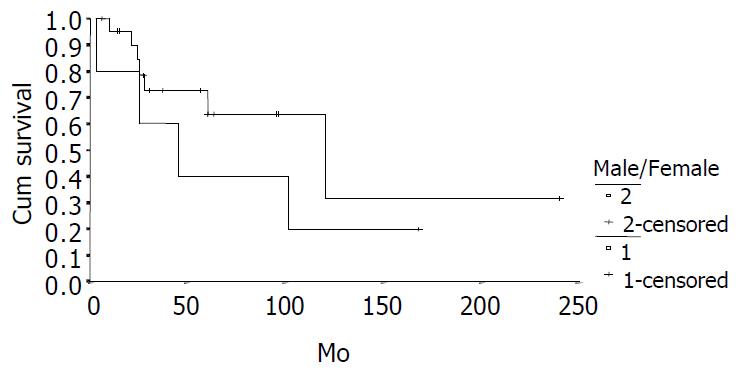
Figure 3 Survival comparison between male (n = 5) and female (n = 23) patients with NFICC (P = 0.
312).
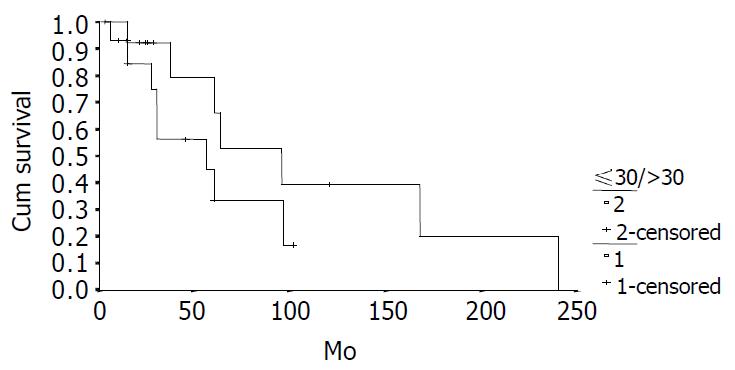
Figure 4 Survival comparison between younger (30 years, n = 14) and elder ( > 30 years, n = 14) patients with NFICC P = 0.
7582).
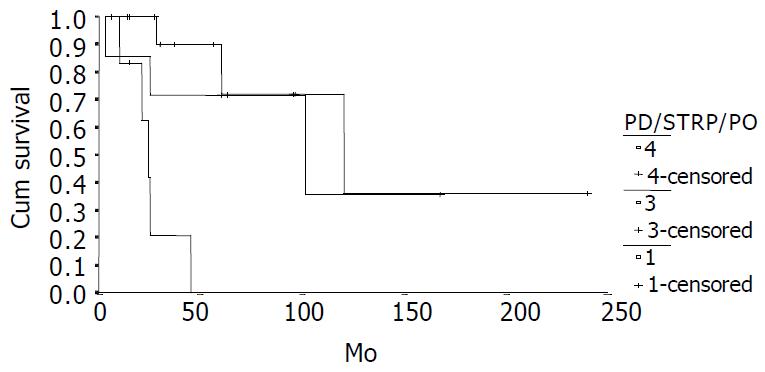
Figure 5 Survival comparison between patients who under-went different operations (PD, n = 7; Subtotal resection of pancreas, n = 14, palliative operation, n = 7, P = 0.
0005).
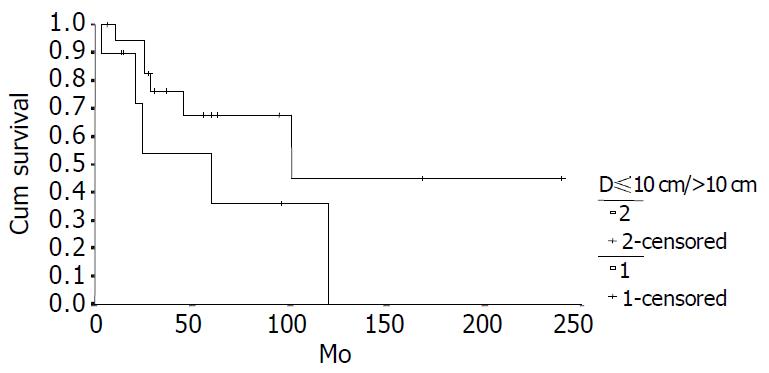
Figure 6 Survival comparison between patients with cancer of different diameters (D10 cm, n = 18; D > 10 cm, n = 10, P = 0.
1169).
- Citation: Liang H, Wang P, Wang XN, Wang JC, Hao XS. Management of nonfunctioning islet cell tumors. World J Gastroenterol 2004; 10(12): 1806-1809
- URL: https://www.wjgnet.com/1007-9327/full/v10/i12/1806.htm
- DOI: https://dx.doi.org/10.3748/wjg.v10.i12.1806


