Copyright
©The Author(s) 2004.
World J Gastroenterol. Jun 15, 2004; 10(12): 1763-1768
Published online Jun 15, 2004. doi: 10.3748/wjg.v10.i12.1763
Published online Jun 15, 2004. doi: 10.3748/wjg.v10.i12.1763
Figure 1 TMP-induced ISC response in T84 and Caco-2 cell lines.
The concentration-response curve for TMP-induced response in T84 and Caco-2 cells, and each datum was obtained from at least 4 individual experiments. A: Values are mean ± SE of maximal ISC increase; B: Representative ISC recordings in response to apical addition of TMP (1 mmol/L) in T84 cells; C: Basolateral application of TMP (5 mmol/L) in Caco-2 cells.
Figure 2 Cl- dependence of TMP-induced ISC increase in T84 cells.
Representative ISC recording with arrows indicating TMP (1mmol/L) added apically, which was blocked by apical adding DPC. Values are mean ± SE; cP < 0.001. A: Normal; B: Cl-free; C: K-HS, comparison of TMP-induced total charge transferred in normal and Cl--free K-HS.
Figure 3 HCO3- dependence of TMP-induced ISC increase in Caco-2 cells.
Representative ISC recording with arrows indicating TMP (5 mmol/L) added basolaterally, which was abolished by apical application of glybenclamide. Values are mean ± SE; aP < 0.05, bP < 0.01 and cP < 0.001. A: Normal; B: Cl-free; C: K-HS, comparison of TMP-induced total charges transferred in normal and Cl--free K-HS.
Figure 4 Effect of inhibitors of basolateral anion transporters on TMP-induced ISC responses.
Values are mean ± SE; cP < 0.001. A: Comparison of TMP (1 mmol/L)-induced ISC responses in T84 cells in the absence and presence of basolateral addition of bumetanide (100 μmol/L); B: Comparison of TMP (5 mmol/L) -induced ISC responses in Caco-2 cells in the absence and presence of basolateral addition of inhibitors indicated.
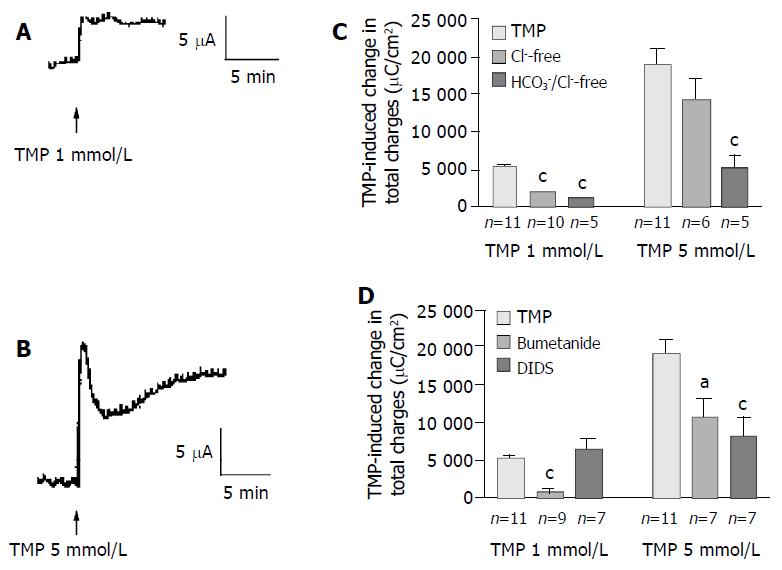
Figure 5 TMP-induced anion secretions in rat colonic mucosa.
Representative ISC recording values are mean ± SE; aP < 0.05, bP < 0.01, cP < 0.001. A: 1 mmol/L; B: 5 mmol/L of TMP added basolaterally in normal K-HS; C: Comparison of TMP (1 and 5 mmol/L)-induced ISC obtained in normal and Cl--free as well as both of Cl- and HCO3- -free solutions; D: Comparison of TMP (1 and 5 mmol/L)-induced ISC obtained in basolateral pretreatment of colonic mucosa with bumetanide (100 µmol/L) and DIDS (100 µmol/L).
Figure 6 RT-PCR analysis of mRNA expression of Na+- HCO3- cotransporter (NBC) in colonic cells.
A: RT-PCR results with products as expected of NBC found in rat colon (1), T84 (2) and Caco-2 (3) with positive control (4) using pancreatic duct cells (CAPAN-1) and negative control (5) where cDNA was omitted. B: Semi-quantitative analysis of NBC expression in Caco-2 (1) ; C: T84 (2) cells with NBC to GAPDH (internal marker) ratio shown.
- Citation: Zhu JX, Yang N, He Q, Tsang LL, Zhao WC, Chung YW, Chan HC. Differential Cl- and HCO3- mediated anion secretion by different colonic cell types in response to tetromethylpyrazine. World J Gastroenterol 2004; 10(12): 1763-1768
- URL: https://www.wjgnet.com/1007-9327/full/v10/i12/1763.htm
- DOI: https://dx.doi.org/10.3748/wjg.v10.i12.1763


