Copyright
©The Author(s) 2004.
World J Gastroenterol. Jun 15, 2004; 10(12): 1730-1734
Published online Jun 15, 2004. doi: 10.3748/wjg.v10.i12.1730
Published online Jun 15, 2004. doi: 10.3748/wjg.v10.i12.1730
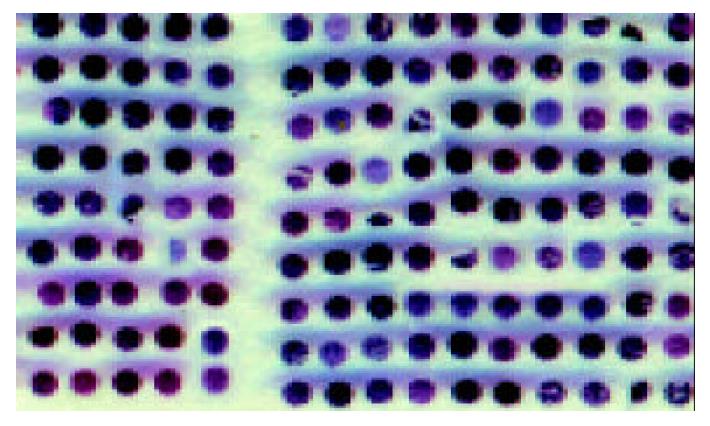
Figure 1 Overview of a piece of tissue microarray including 234 samples (HE staining).
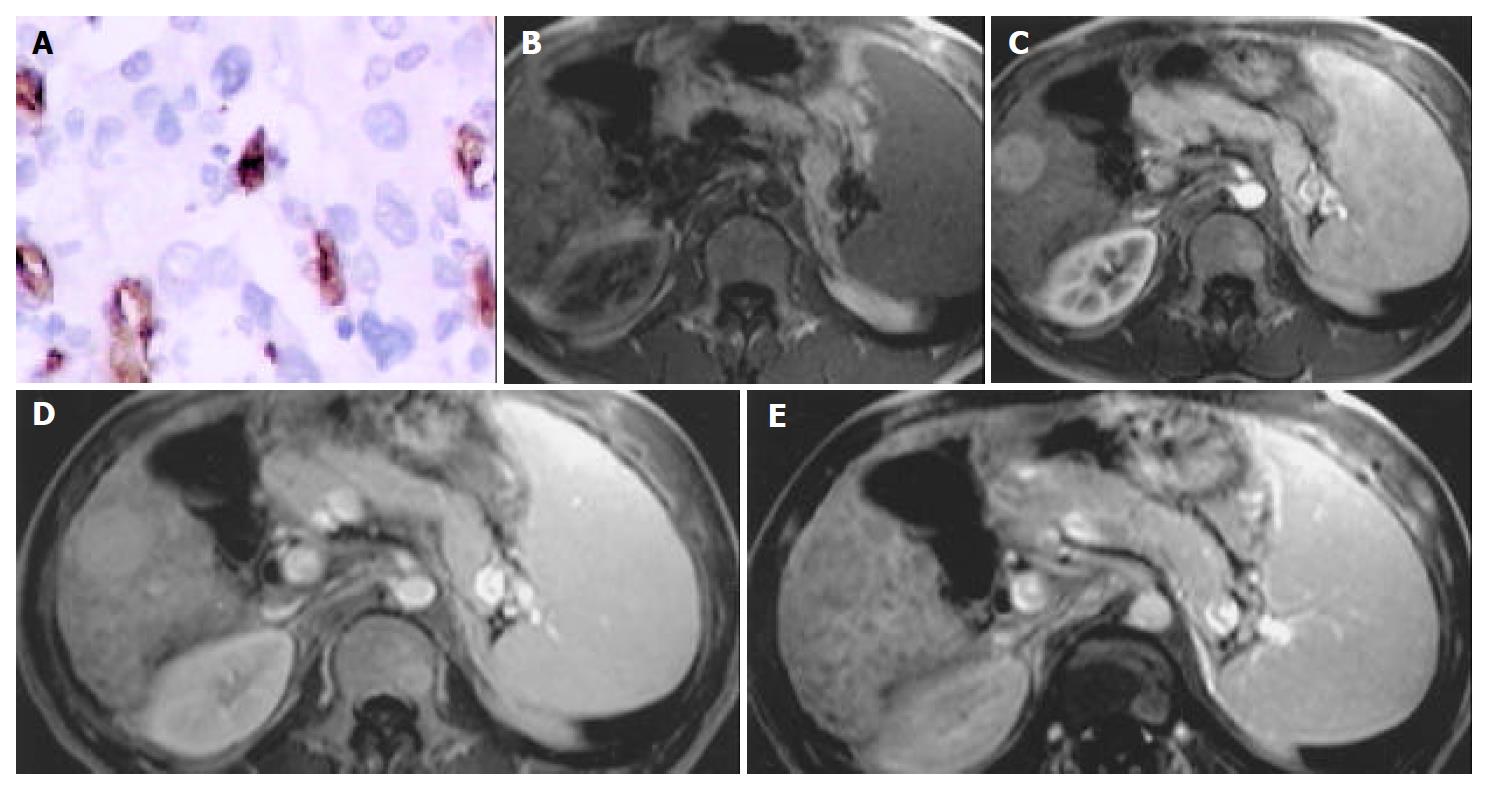
Figure 2 HCC in right lobar of liver.
A: Microvessel density, stained by CD34 (Original magnification: ×200); B: MR image, T1 weighted, nonenhanced, CNR = -1.50; C: MR image, arterial phase, CNR = 11.00; D: MR image, portal venous phase, CNR = 10.50; E: MR image, equilibrium phase, CNR = -6.00.
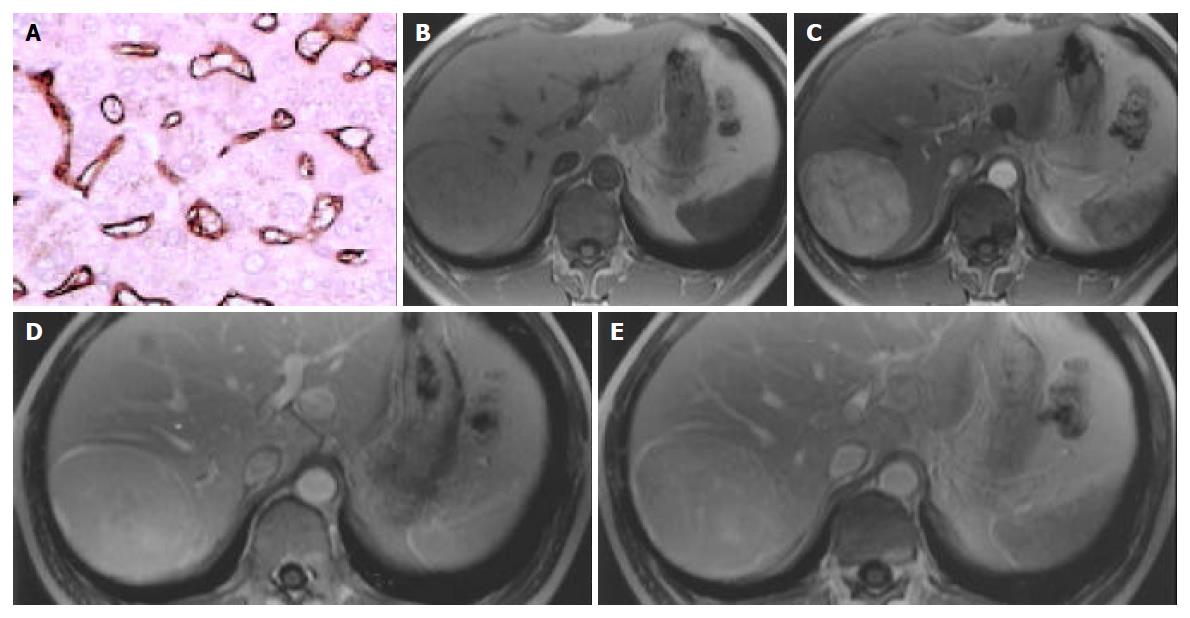
Figure 3 Hepatocellular adenoma in right lobar of liver.
A: Microvessel density, stained by CD34 (Original magnification: ×200); B: MR image, T1 weighted, nonenhanced, CNR = -0.10; C: MR image, arterial phase, CNR = 16.93; D: MR image, portal venous phase, CNR = 9.42; E: MR image, equilibrium phase, CNR = 6.42.
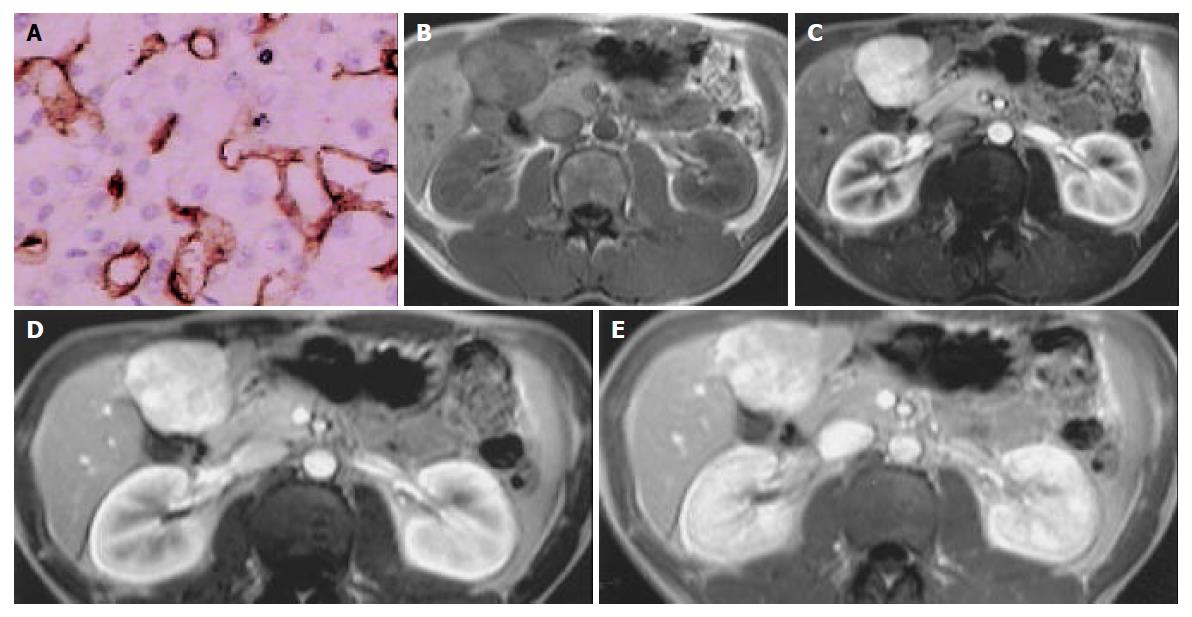
Figure 4 FNH in left inner lobar of liver.
A: Microvessel density, stained by CD34 (Original magnification: ×200); B: MR image, T1 weighted, nonenhanced, CNR = -3.48; C: MR image, arterial phase, CNR = 15.43; D: MR image, portal venous phase, CNR = 5.81; E: MR image, equilibrium phase, CNR = 2.97.
- Citation: Lu JP, Wang J, Wang T, Wang Y, Wu WQ, Gao L. Microvessel density of malignant and benign hepatic lesions and MRI evaluation. World J Gastroenterol 2004; 10(12): 1730-1734
- URL: https://www.wjgnet.com/1007-9327/full/v10/i12/1730.htm
- DOI: https://dx.doi.org/10.3748/wjg.v10.i12.1730


