Copyright
©The Author(s) 2004.
World J Gastroenterol. Jan 1, 2004; 10(1): 73-76
Published online Jan 1, 2004. doi: 10.3748/wjg.v10.i1.73
Published online Jan 1, 2004. doi: 10.3748/wjg.v10.i1.73
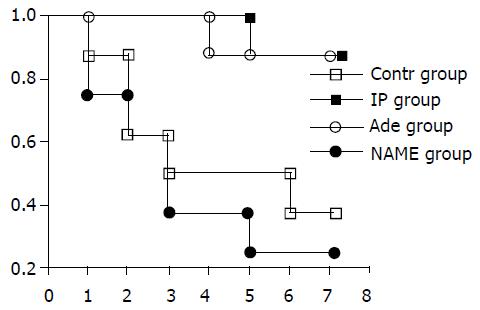
Figure 1 Survival of recipients in different groups.
The donor livers were treated respectively as described in Materials and Methods, and the recipients were divided into control (Contr group), IP-(IP group), adenosine-(Ade group), and NAME-treated groups. The 7-day survival rate was 37.5% (3/8) and 25% (2/8), respectively, in the control group and NAME group, compared with 87.5% (7/8) in both the IP group and adenos-ine group (P < 0.05). The survival curves were calculated using Kaplan-meier‘s methods.
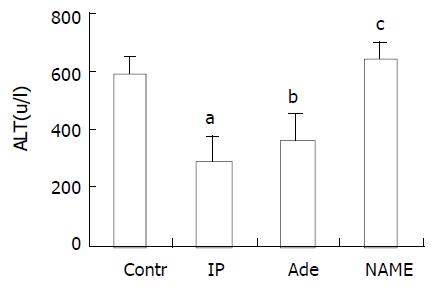
Figure 2 Values of serum ALT in different groups of recipi-ents at 2 hours after ORLT.
The ALT levels in control group and NAME group increased significantly compared with IP group and adenosine group. aP and bP < 0.001, cP > 0.05 vs. con-trol group. The values were expressed as means ± SD.
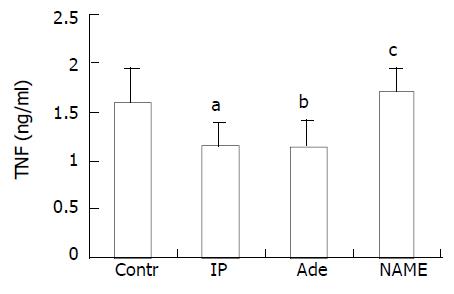
Figure 3 Serum TNF levels measured at 2 hours after ORLT in different recipient groups.
In control and NAME groups, the concentrations of serum TNF were elevated significantly as compared to those in IP and adenosine groups. aP and bP < 0.01, cP > 0.05 vs. control group. Values were expressed as means ± SD.
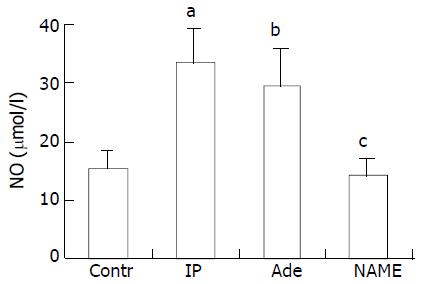
Figure 4 NO levels in serum at 2 hours after ORLT.
When the donor livers were pretreated with IP or adenosine, the serum NO levels were elevated significantly. When IP-treatment fol-lowed by administration with NAME, the serum NO concen-tration was as low as that in control group. aP and bP < 0.001, cP > 0.05 vs. control group. Values were expressed as means ± SD.
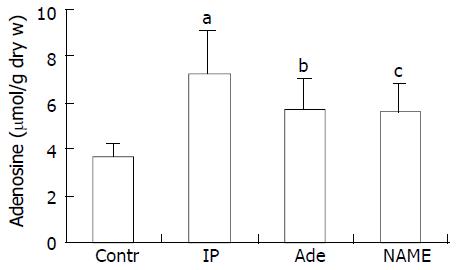
Figure 5 Adenosine concentrations in liver tissues at 2 hours after ORLT.
When the donor livers were pretreated with IP or adenosine, or even the IP-treatment followed NAME, the ad-enosine levels in dry hepatic tissue were elevated as compared to that in control group. aP, bP and cP < 0.05 vs. control group. Results were expressed as means ± SD.
- Citation: Gong JP, Tu B, Wang W, Peng Y, Li SB, Yan LN. Protective effect of nitric oxide induced by ischemic preconditioning on reperfusion injury of rat liver graft. World J Gastroenterol 2004; 10(1): 73-76
- URL: https://www.wjgnet.com/1007-9327/full/v10/i1/73.htm
- DOI: https://dx.doi.org/10.3748/wjg.v10.i1.73


