Copyright
©The Author(s) 2004.
World J Gastroenterol. Jan 1, 2004; 10(1): 46-52
Published online Jan 1, 2004. doi: 10.3748/wjg.v10.i1.46
Published online Jan 1, 2004. doi: 10.3748/wjg.v10.i1.46
Figure 1 Strategy of primers.
To avoid p53 pseudogene co-amplification, the upstream PCR primers P1, P2, and P3 in the region corresponding to introns 4, 5, and 7 were used in combination with downstream primers P4, P5, and P6 within the region corre-sponding to introns 5, 7, and 8 of p53 gene. Primers Pmu and Pmd for RT-PCR located in exons 7 and 8, respectively.
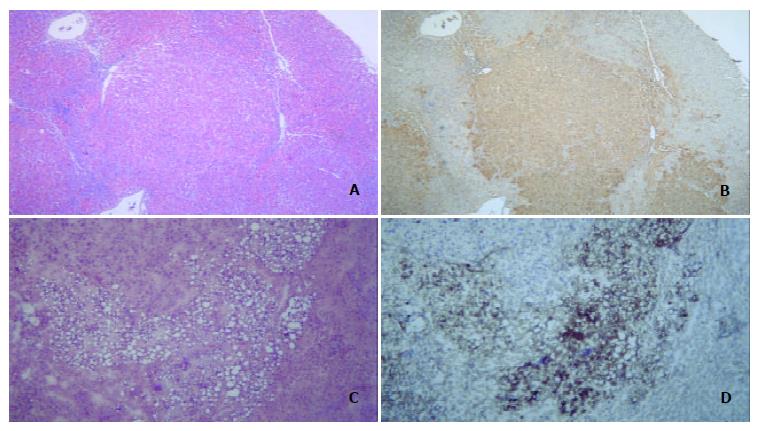
Figure 2 Hepatocarcinogenesis.
A: Prehepatocarcinoma foci were stained by H&E, morphology of prehepatocarcinoma cells was similar to that of normal hepatocytes, and the edge of prehepatocarcinoma focus was distinct and bright. B: Prehepatocarcinoma focus was as intensely stained by GST-P as A. C: Hepatocarcinoma foci by H&E staining showed a lot of foam cells. D: Immuno-histochemical staining for AFP was intense in hepatocarcinoma foci.
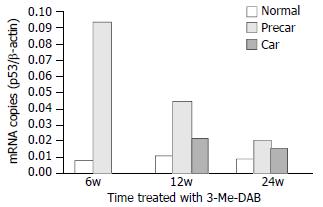
Figure 3 Quantitative analysis of p53 mRNA.
After rats were treated with 3’-Me-DAB for 6, 12 and 24 weeks, the expressions of p53 mRNA were markedly higher in prehepatocarcinoma than in hepatocarcinoma and adjacent normal tissue, P < 0.001. The time course of p53 mRNA showed that mRNA levels peaked at week 6, and gradually decreased to minimum at week 24. Normal = adjacent normal tissue, Precar = prehepatocarcinoma, Car = hepatocarcinoma.
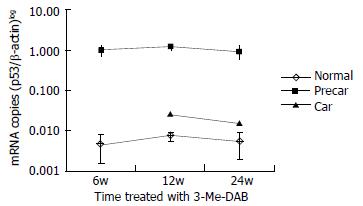
Figure 4 Quantitative analysis of GST-P mRNA.
After rats were treated with 3’-Me-DAB for 6, 12 and 24 weeks, the expressions of GST-P mRNA were markedly higher in prehepatocarcinoma than that in hepatocarcinoma and adjacent normal tissue, P < 0.001, and also higher in hepatocarcinoma than that in adjacent normal tissue, P < 0.001. GST-P mRNA levels were expressed on a logarithmic scale. Normal = a djacent normal tissue, Precar = prehepatocarcinoma, Car = hepatocarcinoma.
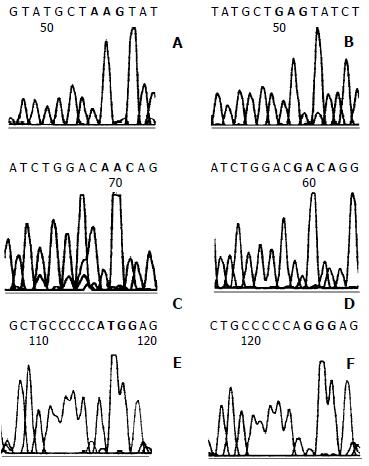
Figure 5 Direct sequencing of p53 exons 6/7 and 8.
A: GAG to AAG transition mutation (red box) at codon 202 of exon 6/7 was seen in prehepatocarcinoma foci at 6 weeks. C: Four hepatocarcinoma foci with GAC to AAC transition mutation (red box) at codon 206 formed one of the mutation hot spots. E: GGG to TGG transversion mutation (red box) at codon 300 of exon 8 in hepatocarcinoma foci. B, D and F were normal sequence.
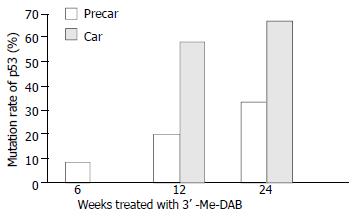
Figure 6 Mutation ratio of p53 exons 6/7 and 8 in prehepatoca-rcinoma (precar) and hepatocarcinoma foci (car).
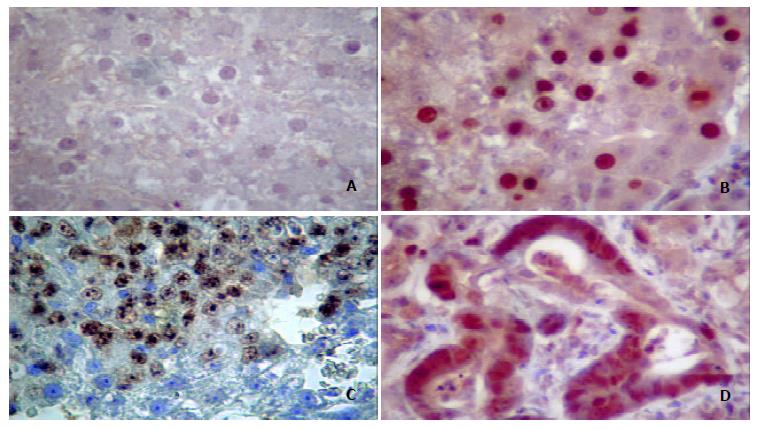
Figure 7 Mutant p53 protein expressions in prehepatocancer and hepatocancer.
A: Normal tissue. B: Nuclei of prehepatocarcinoma cells immunostained by anti-p53 Ab1. C: Nuclei of hepatocellular carcinoma cells stained by anti-p53 Ab1. D: Nuclei of adenohepatoma cells stained by anti-p53 Ab1. Enlarged nuclei intensely stained for Ab1 were seen in cells. Original magnification 400 × .
- Citation: Deng WG, Fu Y, Li YL, Sugiyama T. Potential role of p53 mutation in chemical hepatocarcinogenesis of rats. World J Gastroenterol 2004; 10(1): 46-52
- URL: https://www.wjgnet.com/1007-9327/full/v10/i1/46.htm
- DOI: https://dx.doi.org/10.3748/wjg.v10.i1.46


