Copyright
©The Author(s) 2004.
World J Gastroenterol. Jan 1, 2004; 10(1): 112-116
Published online Jan 1, 2004. doi: 10.3748/wjg.v10.i1.112
Published online Jan 1, 2004. doi: 10.3748/wjg.v10.i1.112
Figure 1 Structure of rAAV-ET vector.
ITR: AAV-2 inverted terminal repeats, tetO-CMV: tetracycline-inducible promoter including seven repeats of the tetracycline operator inserted upstream of the CMV minimal promoter, mEpo: murine eryth-ropoietin cDNA, (A)n: SV4O bidirectional polyadenylation signal, rtTA: coding sequences for the tetracycline reverse transactivator, LTR: long terminal repeat of the MFG retrovirus construct. The BamHI fragment used as an Epo-specific probe is indicated.
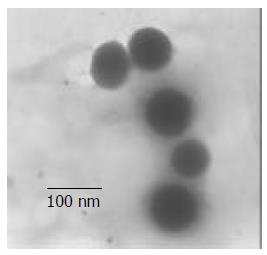
Figure 2 Measurement of microsphere size and morphology.
Transmission electron micrographs of chitosan–DNA nanoparticles, and scale bar represents 100 nm.
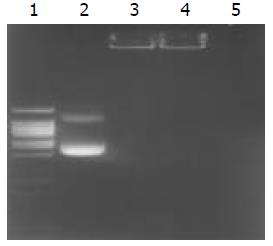
Figure 3 Determination of encapsulation coefficiency, and DNase degradation test.
Line 1. DNA ladder, Line2. undegraded pCMVβ (1 μg), Line 3. undegraded chitosan-DNA complex (containing plasmid 1 μg), Line 4. degraded chitosan-DNA com-plex (containing plasmid 1 μg), Line 5. degraded plasmid (1 μg).
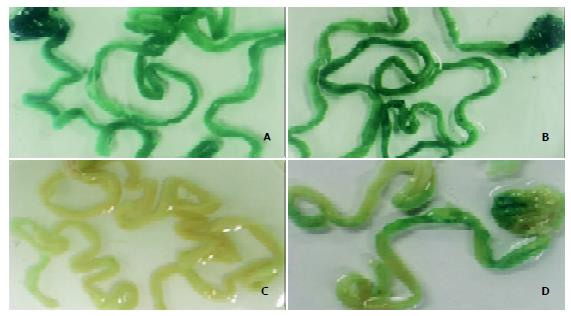
Figure 4 β-galactosidase expression in mouse stomach and small intestine 3 days after oral delivery of DNA nanoparticles.
A-D: Whole tissue staining for LacZ, only stained sections are shown. The mice were fed with high-molecular-weight chitosan-pCMVβ nanospheres at a dose of 50 μg (A) or 100 μg (B) per mouse, PBS (C) or ‘naked’ DNA (pCMVβ, D).
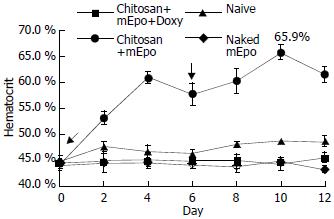
Figure 5 mEpo expression and its physiological effect test.
He-matocrit was measured every two days in mice fed with (●) chitosan-mEpo and doxycycline (200 µg/mL), n = 9; (▲) chitosan-mEpo alone, n = 3; (◆) doxycycline (200 µg/mL) alone, n = 4; (■) naked mEpo and doxycycline (200 µg/mL), n = 5.↓indicating the mice fed with ‘naked’ mEpo DNA or chitosan-Epo.
- Citation: Chen J, Yang WL, Li G, Qian J, Xue JL, Fu SK, Lu DR. Transfection of mEpo gene to intestinal epithelium in vivo mediated by oral delivery of chitosan-DNA nanoparticles. World J Gastroenterol 2004; 10(1): 112-116
- URL: https://www.wjgnet.com/1007-9327/full/v10/i1/112.htm
- DOI: https://dx.doi.org/10.3748/wjg.v10.i1.112


