Copyright
©The Author(s) 2020.
Artif Intell Med Imaging. Sep 28, 2020; 1(3): 94-107
Published online Sep 28, 2020. doi: 10.35711/aimi.v1.i3.94
Published online Sep 28, 2020. doi: 10.35711/aimi.v1.i3.94
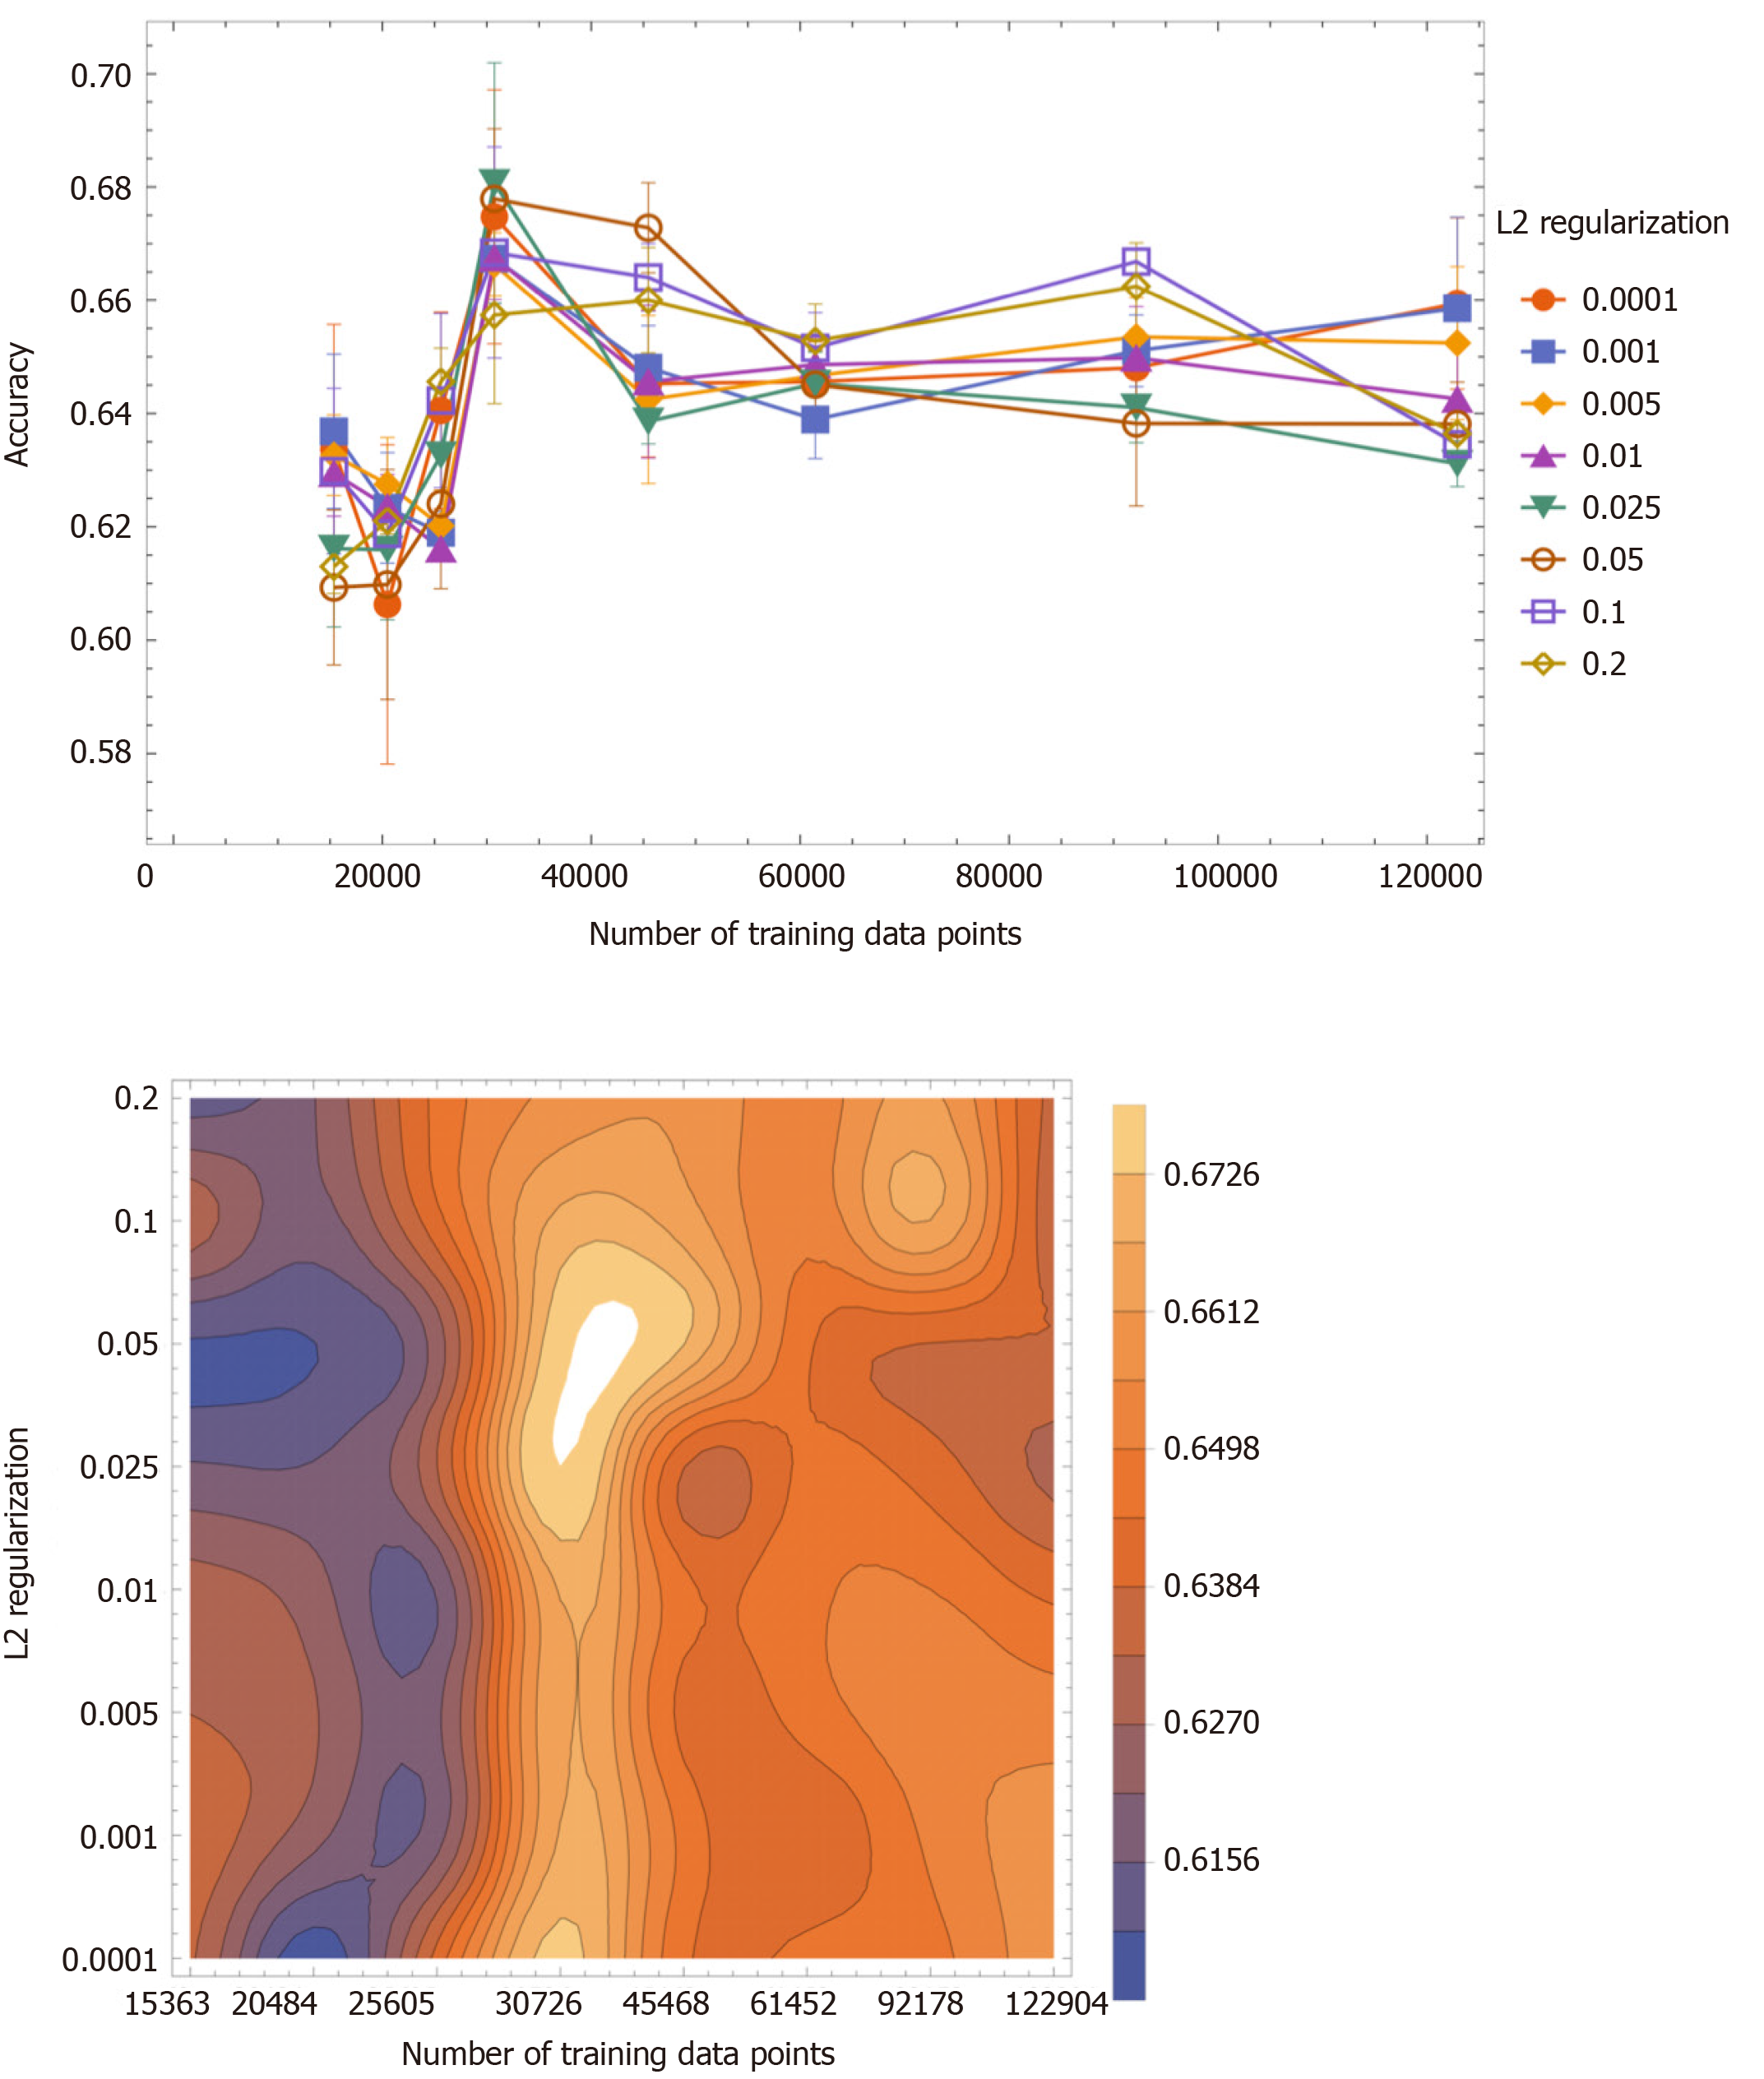
Figure 2 The accuracy value (mean ± SD) as a function of the number of training data points.
The accuracy values were classified with L2 regularization values: 0.0001, 0.001, 0.005, 0.01, 0.025, 0.05, 0.1 and 0.2. High accuracy values were obtained when the number of training data was between 25605 and 45468 (left panel). The two-dimensional contour plot of the accuracy value as a function of the training data and L2 regularization values (right panel). The brighter area indicates higher accuracy. High accuracy values were observed when the number of the training data was between 25605 and 45468 and when L2 regularization values were less than 0.1.
- Citation: Miyagi Y, Habara T, Hirata R, Hayashi N. Predicting a live birth by artificial intelligence incorporating both the blastocyst image and conventional embryo evaluation parameters. Artif Intell Med Imaging 2020; 1(3): 94-107
- URL: https://www.wjgnet.com/2644-3260/full/v1/i3/94.htm
- DOI: https://dx.doi.org/10.35711/aimi.v1.i3.94


