Copyright
©The Author(s) 2024.
Artif Intell Cancer. Jul 18, 2024; 5(1): 96690
Published online Jul 18, 2024. doi: 10.35713/aic.v5.i1.96690
Published online Jul 18, 2024. doi: 10.35713/aic.v5.i1.96690
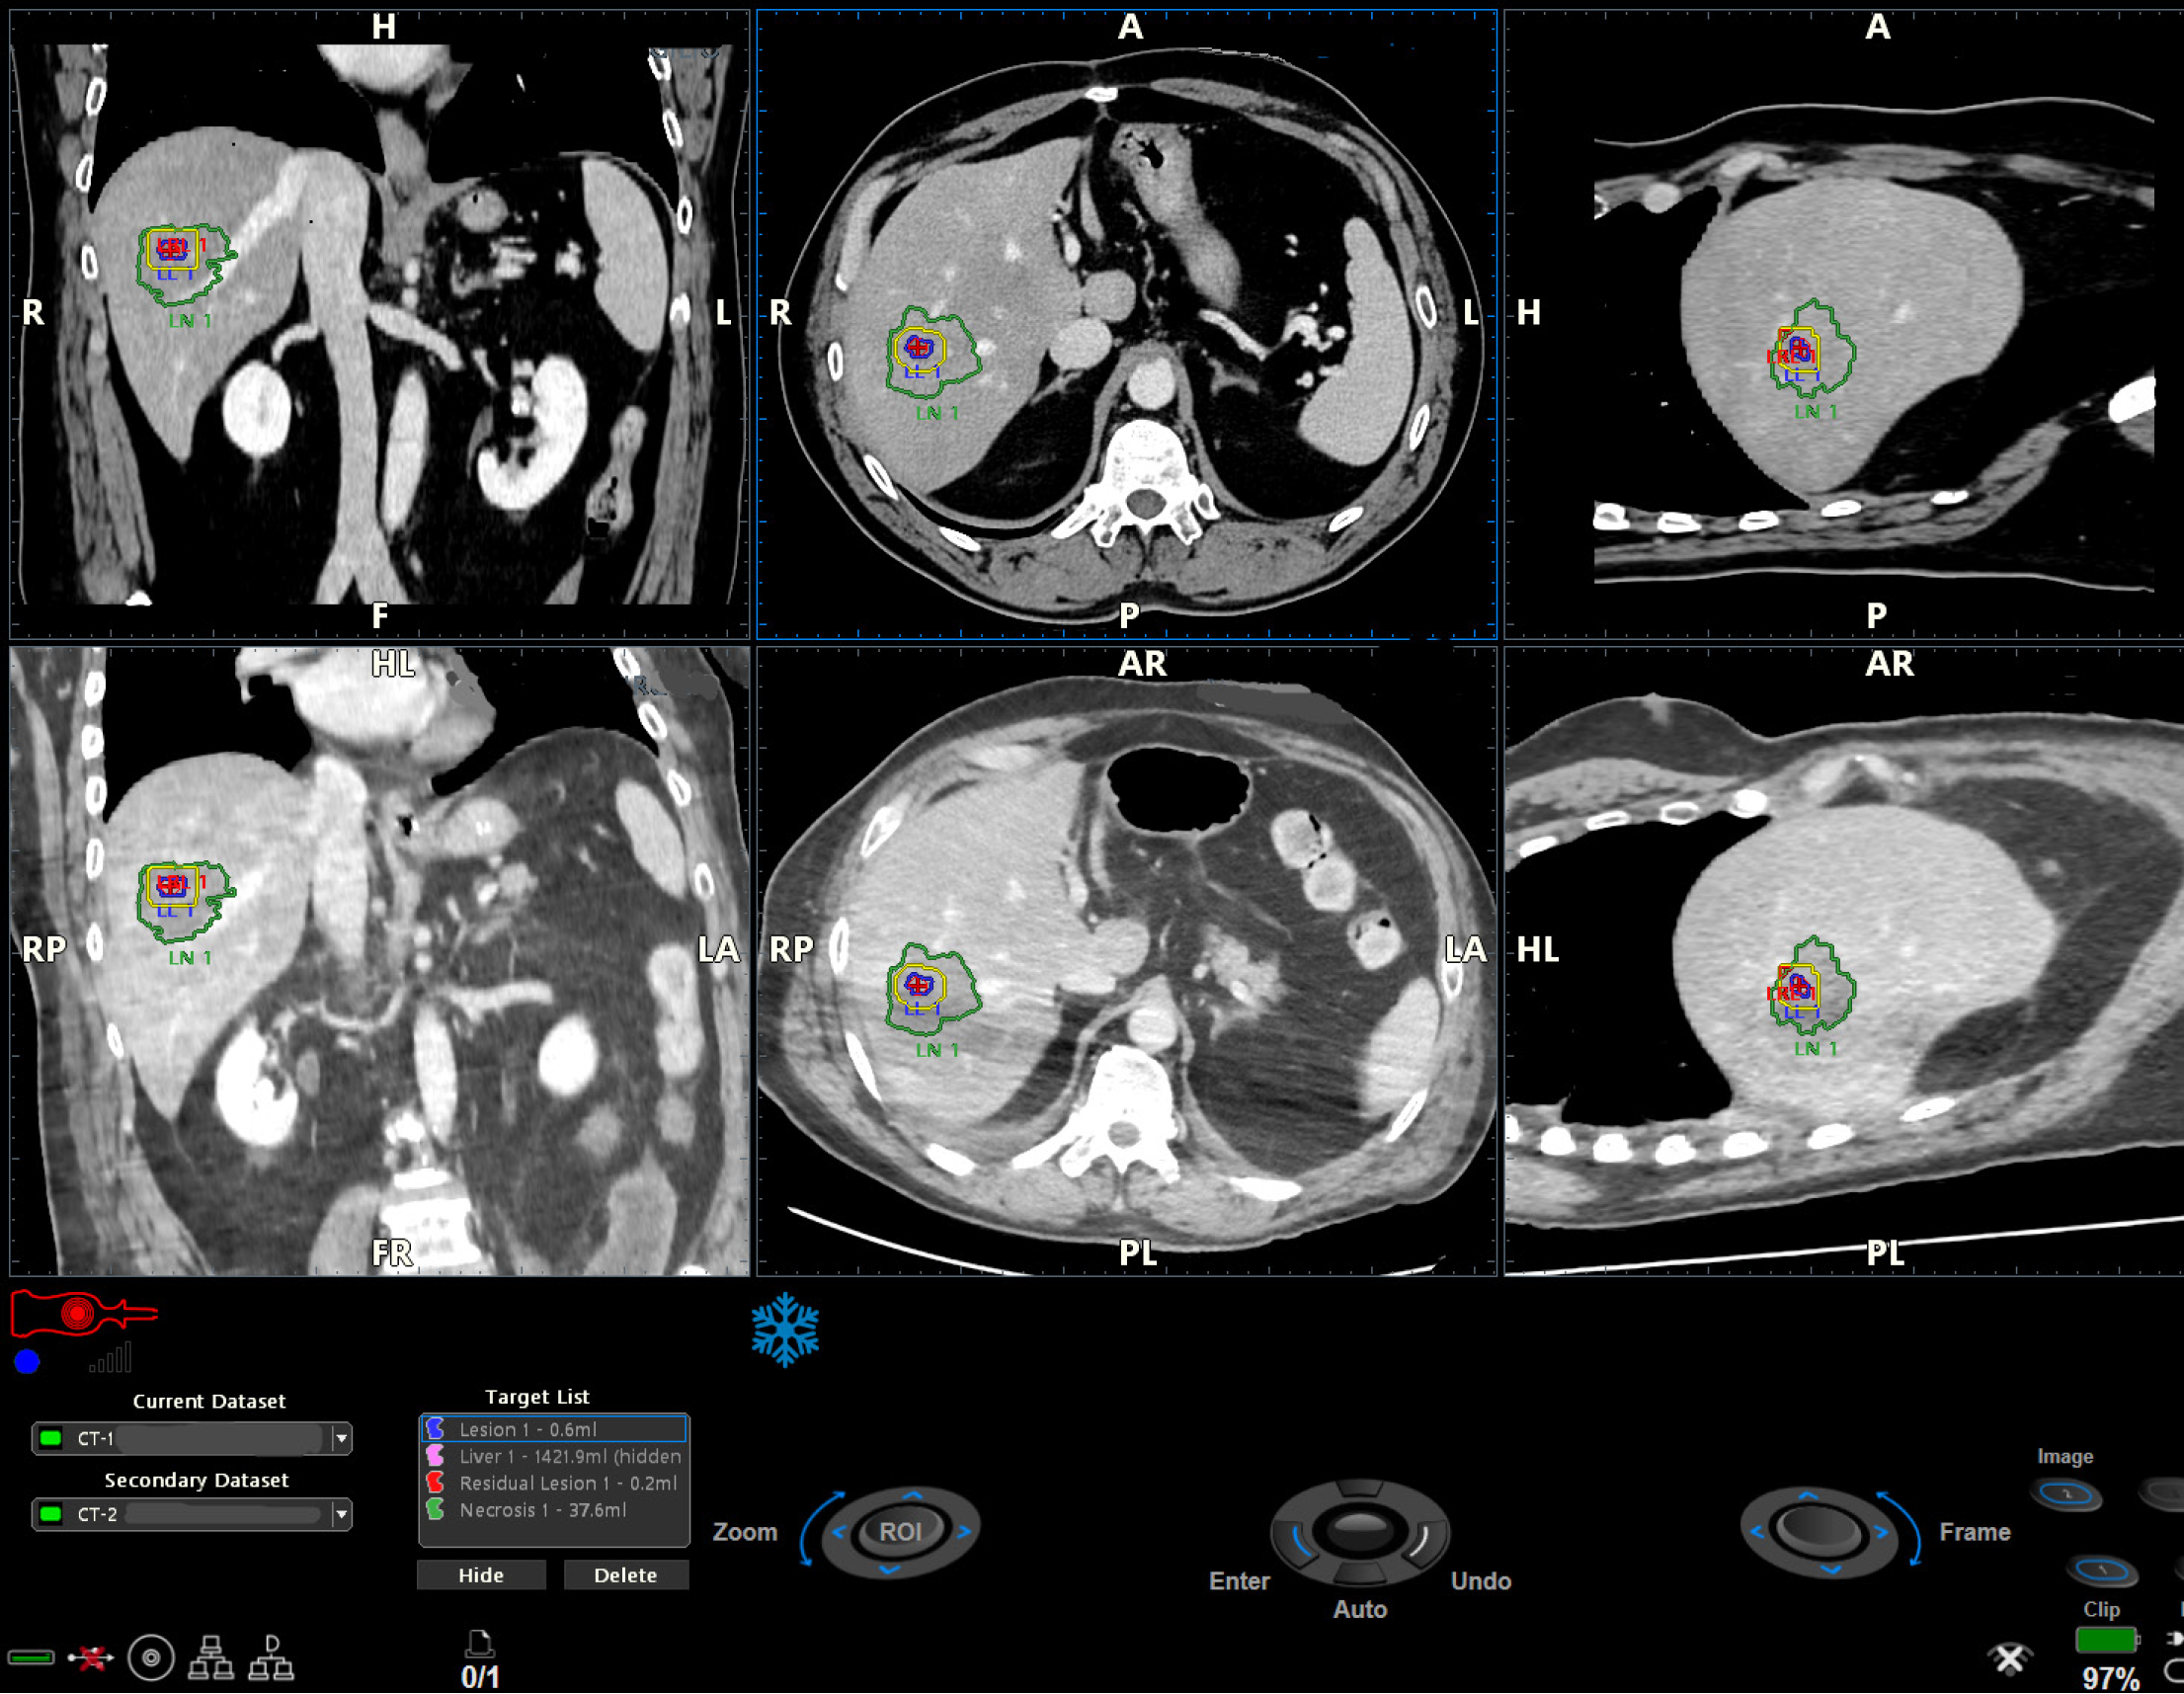
Figure 6
Detail of Figure 4: The pre-ablation dataset (upper series), the post-ablation dataset (lower series), the lesion (red circle and blue line), the safety margin calculated by the software (yellow perimeter), and the necrosis area (green perimeter) are displayed in the three plans.
- Citation: Tombesi P, Cutini A, Grasso V, Di Vece F, Politti U, Capatti E, Labb F, Petaccia S, Sartori S. Past, present, and future perspectives of ultrasound-guided ablation of liver tumors: Where could artificial intelligence lead interventional oncology? Artif Intell Cancer 2024; 5(1): 96690
- URL: https://www.wjgnet.com/2644-3228/full/v5/i1/96690.htm
- DOI: https://dx.doi.org/10.35713/aic.v5.i1.96690


