Copyright
©The Author(s) 2020.
World J Meta-Anal. Apr 28, 2020; 8(2): 119-152
Published online Apr 28, 2020. doi: 10.13105/wjma.v8.i2.119
Published online Apr 28, 2020. doi: 10.13105/wjma.v8.i2.119
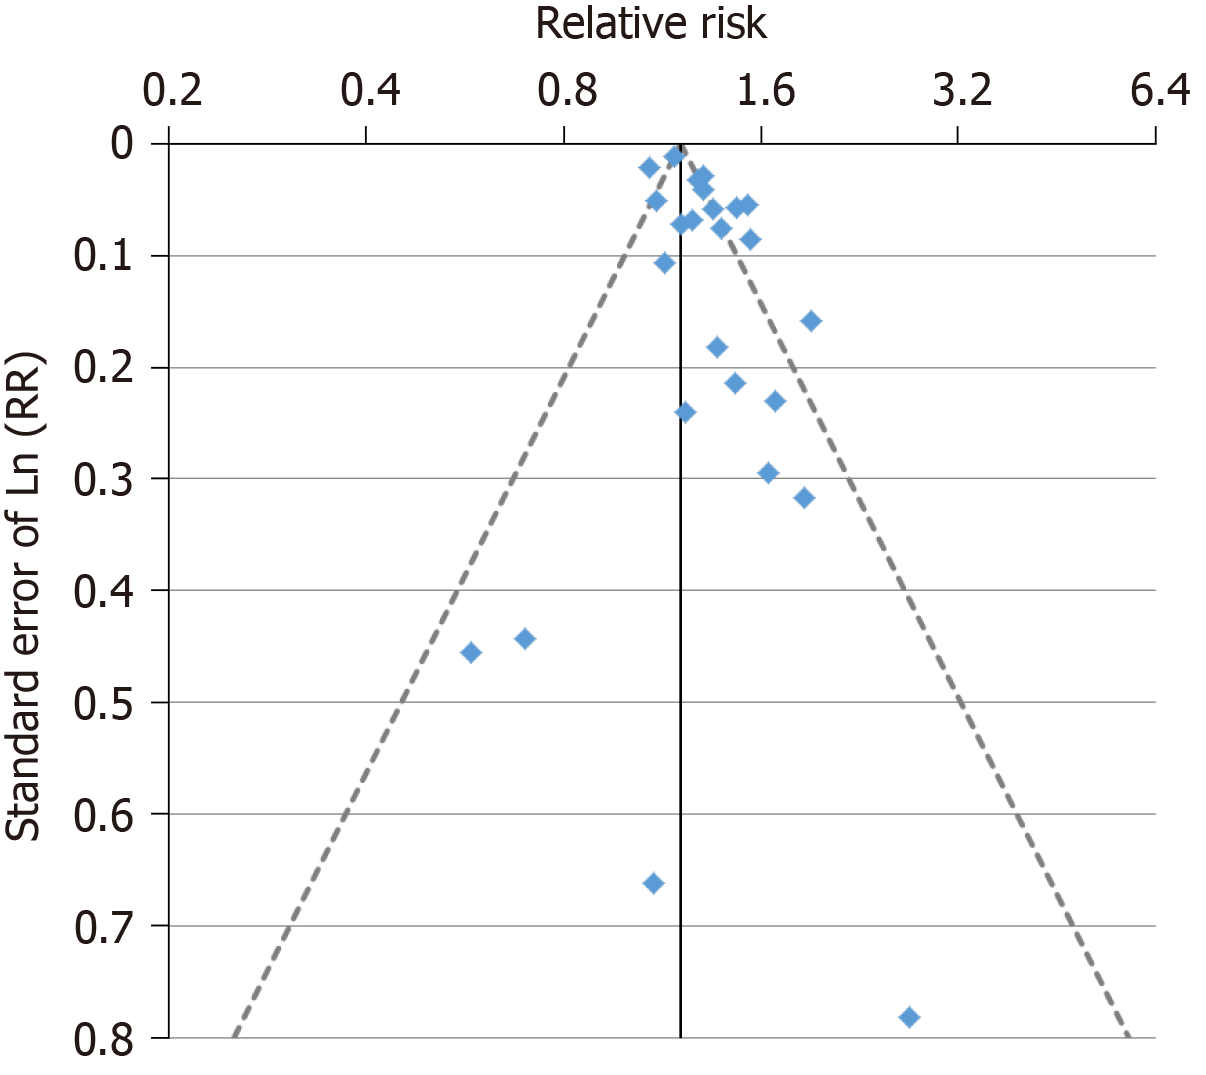
Figure 4 Funnel plot for current vs never smoking, results for females.
Each of the selected relative risks (RRs) is shown as a diamond, plotted against its value on the x-axis (on a log scale) and the standard error of loge RR on the y-axis. The vertical line indicates the overall fixed-effect estimate, while the diagonals indicate where 95% of the values should lie, given the standard error of loge RR. Evidence of publication bias is indicated by a tendency for the smaller (high standard error) studies to show larger treatment effects. RR: Relative risk.
- Citation: Lee PN, Coombs KJ. Systematic review with meta-analysis of the epidemiological evidence relating smoking to type 2 diabetes. World J Meta-Anal 2020; 8(2): 119-152
- URL: https://www.wjgnet.com/2308-3840/full/v8/i2/119.htm
- DOI: https://dx.doi.org/10.13105/wjma.v8.i2.119


