Copyright
©The Author(s) 2019.
World J Meta-Anal. Jun 30, 2019; 7(6): 309-322
Published online Jun 30, 2019. doi: 10.13105/wjma.v7.i6.309
Published online Jun 30, 2019. doi: 10.13105/wjma.v7.i6.309
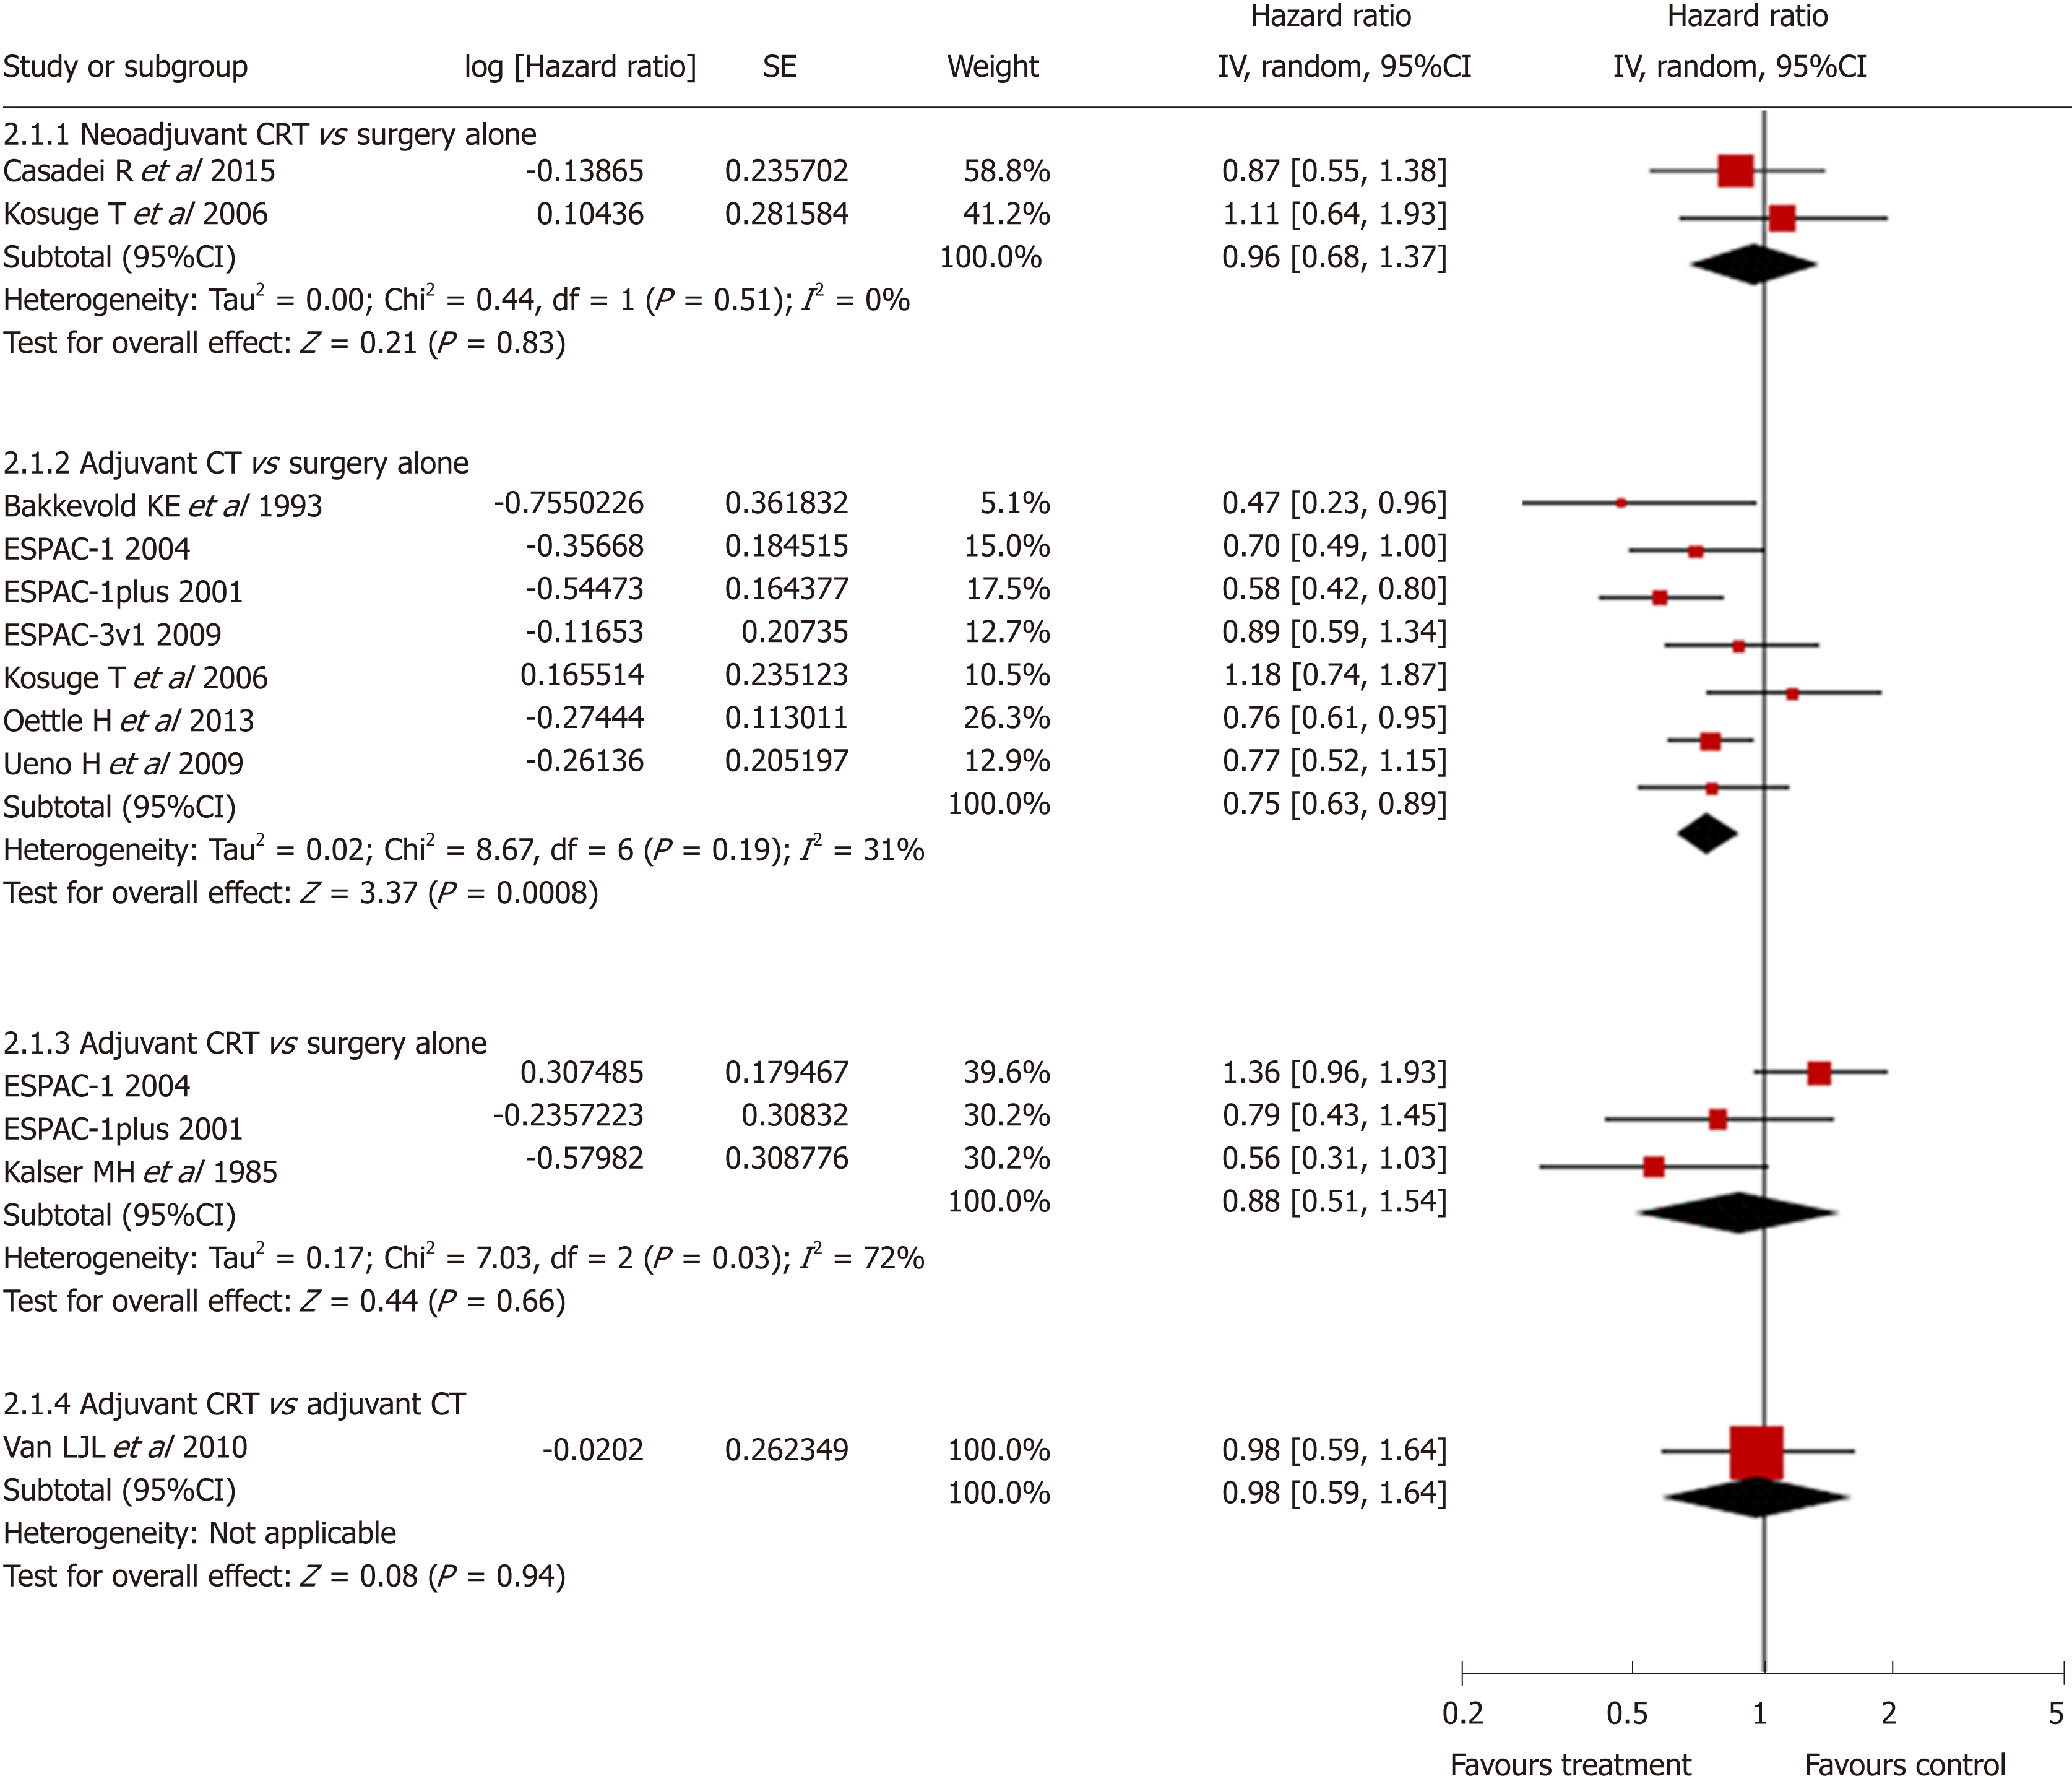
Figure 3 Forest plot of direct comparison meta-analysis of overall survival.
Squares and horizontal lines correspond to the study-specific HRs and 95% CIs, respectively. The area of the squares correlates with the weight of each enrolled study, and the diamonds represent the summary HRs and 95% CIs. HRs: Hazard ratios; CI: Confidence interval.
- Citation: Shen P, Huang KJ, Zhang CZ, Xiao L, Zhang T. Surgery with adjuvant or neoadjuvant treatment vs surgery alone for resectable pancreatic cancer: A network meta-analysis. World J Meta-Anal 2019; 7(6): 309-322
- URL: https://www.wjgnet.com/2308-3840/full/v7/i6/309.htm
- DOI: https://dx.doi.org/10.13105/wjma.v7.i6.309


