Copyright
©The Author(s) 2015.
World J Meta-Anal. Oct 26, 2015; 3(5): 215-224
Published online Oct 26, 2015. doi: 10.13105/wjma.v3.i5.215
Published online Oct 26, 2015. doi: 10.13105/wjma.v3.i5.215
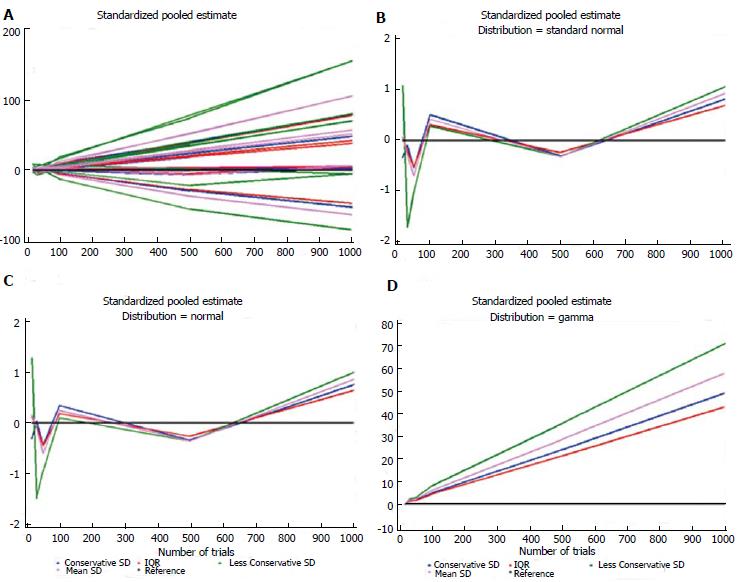
Figure 1 Value of each standardized estimate, θstandijk, for each number of dataset included in the corresponding meta-analysis simulated.
A: All distributions together; B: Normal (mean = 5 and SD = 2 for the treatment group; mean = 7 and SD = 2 for the control group); C: Standardized Normal; D: Gamma (alpha = 2 and beta = 5 for the treatment group; alpha = 2 and beta = 7 for the control group). The X-axis represents the number of studies (datasets) included in the meta-analysis. For each approximation method (blue line for the conservative estimate of SD, green line for the less conservative estimate of SD, pink line for the mean estimate of SD, and red line for the interquartile range), the Y-axis reports the difference between the standardized estimate and the reference (black line). IQR: Interquartile range.
- Citation: Greco T, Biondi-Zoccai G, Gemma M, Guérin C, Zangrillo A, Landoni G. How to impute study-specific standard deviations in meta-analyses of skewed continuous endpoints? World J Meta-Anal 2015; 3(5): 215-224
- URL: https://www.wjgnet.com/2308-3840/full/v3/i5/215.htm
- DOI: https://dx.doi.org/10.13105/wjma.v3.i5.215


