Copyright
©2014 Baishideng Publishing Group Inc.
World J Meta-Anal. Aug 26, 2014; 2(3): 127-134
Published online Aug 26, 2014. doi: 10.13105/wjma.v2.i3.127
Published online Aug 26, 2014. doi: 10.13105/wjma.v2.i3.127
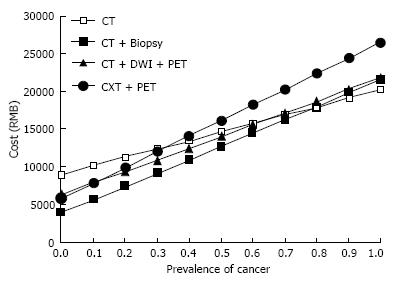
Figure 3 Correlation between the prevalence of cancer and total costs per patient.
The total costs per patients were increased regardless of the strategies and the difference among the strategies became small, although the CT+PET alone strategy had the highest cost at the prevalence of 50%. PET: Positron emission tomography; CT: Computed tomography.
- Citation: Lu B, Sun LX, Yan X, Ai ZZ, Xu JZ. Decision-tree analysis for cost-effective management of solitary pulmonary nodules in China. World J Meta-Anal 2014; 2(3): 127-134
- URL: https://www.wjgnet.com/2308-3840/full/v2/i3/127.htm
- DOI: https://dx.doi.org/10.13105/wjma.v2.i3.127


