Copyright
©2013 Baishideng Publishing Group Co.
World J Meta-Anal. Nov 26, 2013; 1(3): 147-156
Published online Nov 26, 2013. doi: 10.13105/wjma.v1.i3.147
Published online Nov 26, 2013. doi: 10.13105/wjma.v1.i3.147
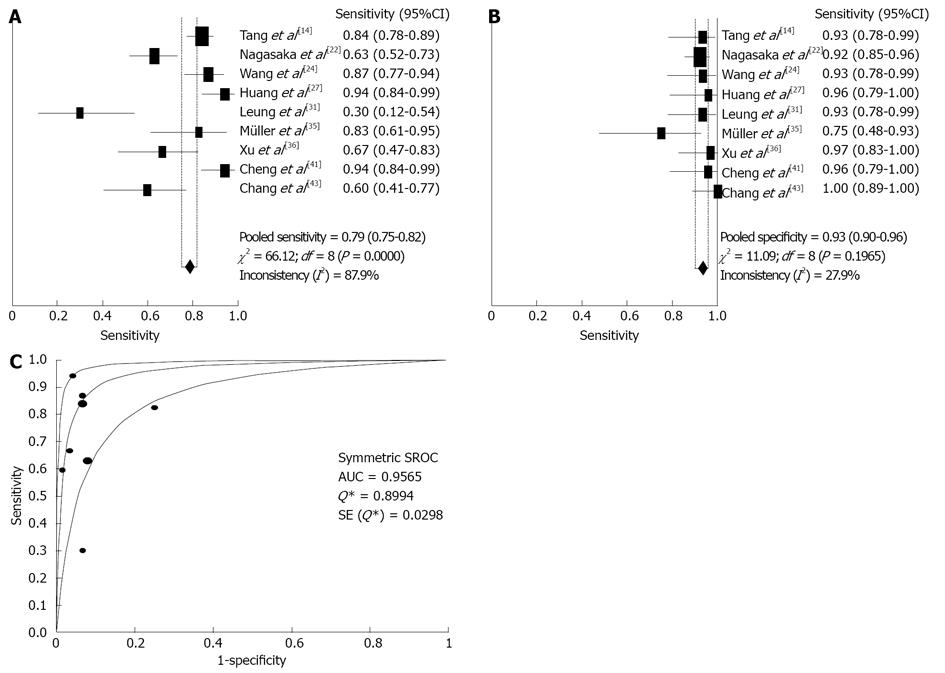
Figure 2 Forest plot of SFRP2 methylation in the diagnosis of colorectal cancer.
A: The sensitivity of SFRP2 methylation in stool samples used for colorectal carcinoma diagnosis. The point estimates of specificity from each study are shown as red squares; B: The specificity of SFRP2 methylation in stool samples used for colorectal cancer diagnosis. The point estimates of specificity from each study are shown as blue squares; C: The summary receiver operating characteristic curves of SFRP2 methylation assays used for diagnosis of colorectal carcinoma. Red circles represent each study that was included in the meta-analysis. The size of each study is indicated by the size of the red circle. Summary receiver operating characteristic curves summarize the overall diagnostic accuracy. Error bars indicate the 95%CI, and df indicates the degrees of freedom.
- Citation: Zhang H, Zhu YQ, Qi J, Wang QX, Cai SS, Zhu SY, Zhu XW, Wang XT. Accuracy of early detection of colorectal tumours using stool methylation markers: A meta-analysis. World J Meta-Anal 2013; 1(3): 147-156
- URL: https://www.wjgnet.com/2308-3840/full/v1/i3/147.htm
- DOI: https://dx.doi.org/10.13105/wjma.v1.i3.147


