Copyright
©2013 Baishideng Publishing Group Co.
World J Meta-Anal. Nov 26, 2013; 1(3): 130-137
Published online Nov 26, 2013. doi: 10.13105/wjma.v1.i3.130
Published online Nov 26, 2013. doi: 10.13105/wjma.v1.i3.130
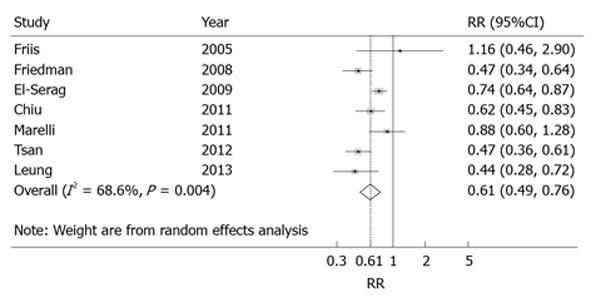
Figure 2 Forest plot of pooled relative risks and their 95%CI for statin use and the risk of liver cancer, when using random effects model.
Studies are arranged based on the year of publication. Black boxes indicate the relative risks point estimate, and their areas are proportional to the weights of the studies. Horizontal lines represent the 95%CIs. The broken line and diamond represent the summary estimate and the unbroken vertical line is at the null value.
- Citation: Zhang H, Gao C, Fang L, Yao SK. Statin use and risk of liver cancer: A meta-analysis of 7 studies involving more than 4.7 million patients. World J Meta-Anal 2013; 1(3): 130-137
- URL: https://www.wjgnet.com/2308-3840/full/v1/i3/130.htm
- DOI: https://dx.doi.org/10.13105/wjma.v1.i3.130


