Copyright
©2013 Baishideng.
World J Meta-Anal. May 26, 2013; 1(1): 16-26
Published online May 26, 2013. doi: 10.13105/wjma.v1.i1.16
Published online May 26, 2013. doi: 10.13105/wjma.v1.i1.16
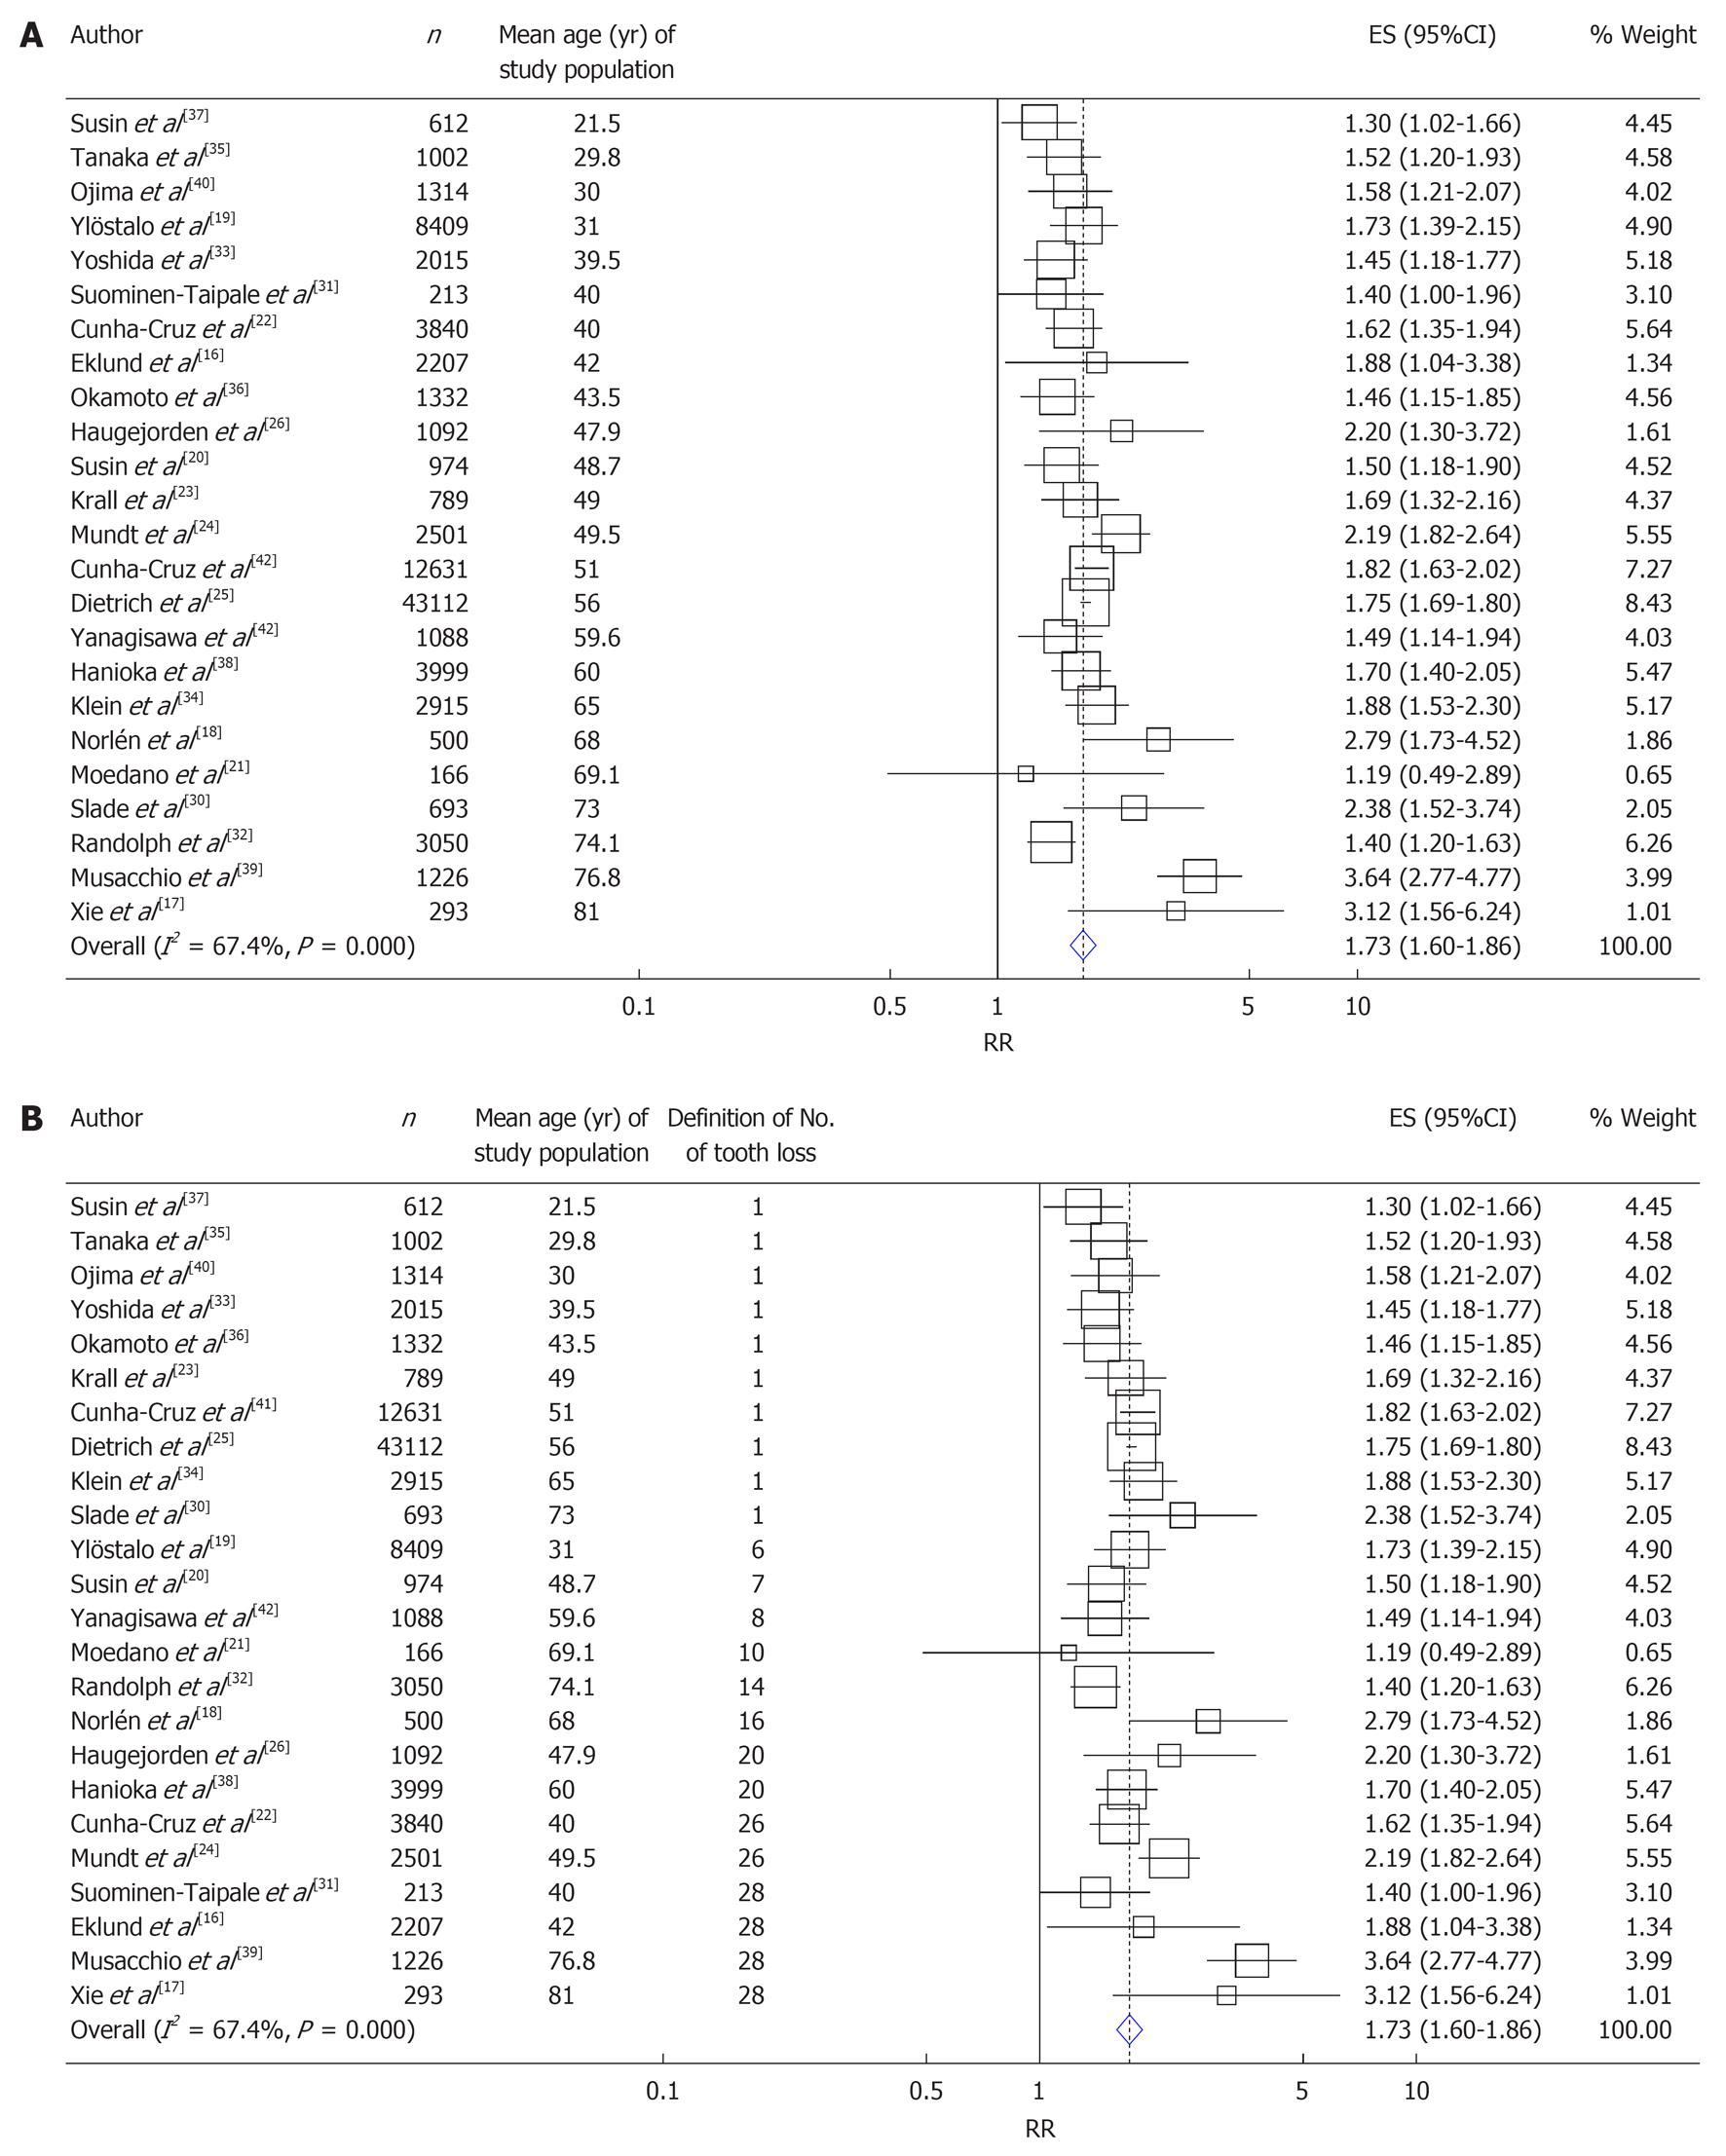
Figure 3 Forest plots of relative risk sorted by mean age of the study population (A) and by the number of teeth lost defined as representing a case (B).
A: The size of the squares corresponds to the weight of the study in the meta-analysis. Combined relative risk was calculated using the random-effects model; B: The studies with definition of 1 means those losing one or more teeth were defined as cases. The size of the squares corresponds to the weight of the study in the meta-analysis. Combined relative risk was calculated using the random-effects model. Weights are from random effects analysis.
- Citation: Sato F, Sawamura M, Ojima M, Tanaka K, Hanioka T, Tanaka H, Matsuo K. Smoking increases risk of tooth loss: A meta-analysis of the literature. World J Meta-Anal 2013; 1(1): 16-26
- URL: https://www.wjgnet.com/2308-3840/full/v1/i1/16.htm
- DOI: https://dx.doi.org/10.13105/wjma.v1.i1.16


