Copyright
©The Author(s) 2021.
World J Clin Cases. Mar 6, 2021; 9(7): 1563-1579
Published online Mar 6, 2021. doi: 10.12998/wjcc.v9.i7.1563
Published online Mar 6, 2021. doi: 10.12998/wjcc.v9.i7.1563
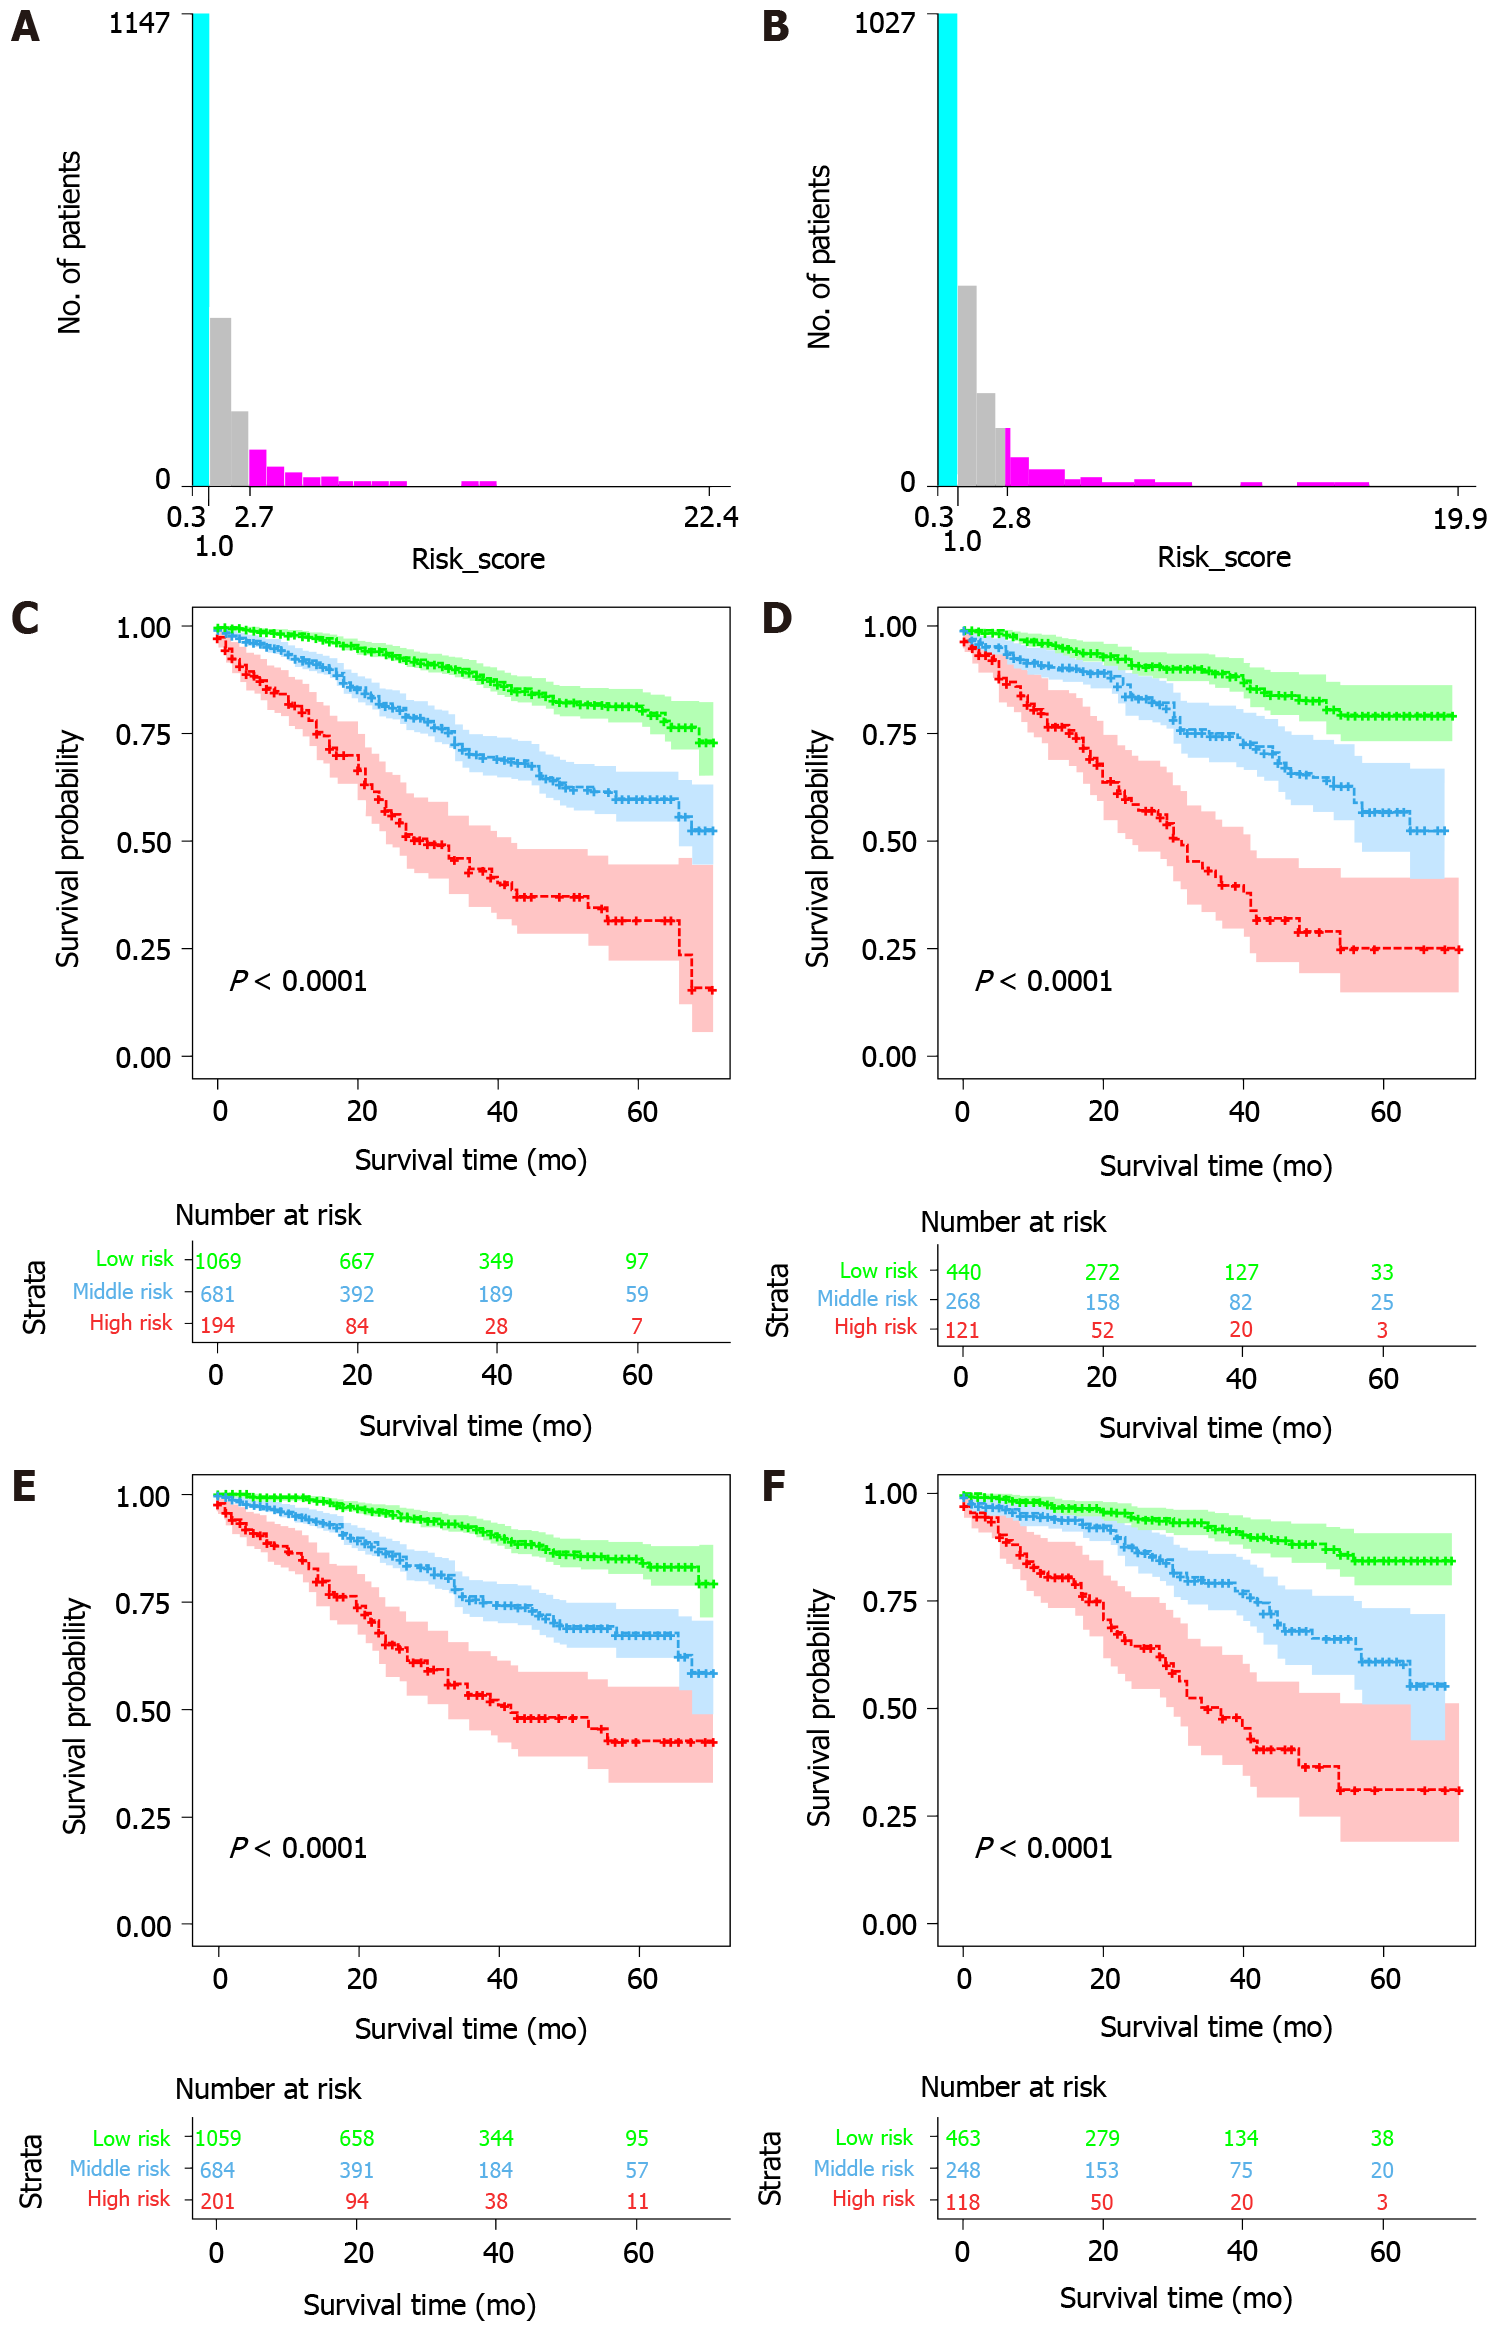
Figure 4 Kaplan-Meier survival curves for low-, medium-, and high-risk groups based on risk scores.
The optimal overall survival (OS) risk score cutoffs were 1 and 2.7. Cancer-specific survival (CSS) risk score cutoffs were 1 and 2.8. Significant differences in OS and CSS were observed between low-risk, intermediate-risk, and high-risk patients in the training and validation cohorts. A: OS risk score cutoff value; B: CSS risk score cutoff value; C: Risk-stratified survival curve for OS in the training cohort; D: Risk-stratified survival curve for OS in the validation cohort; E: Risk-stratified survival curve for CSS in the training cohort; F: Risk-stratified survival curve for CSS in the validation cohort.
- Citation: Liu H, Li Y, Qu YD, Zhao JJ, Zheng ZW, Jiao XL, Zhang J. Construction of a clinical survival prognostic model for middle-aged and elderly patients with stage III rectal adenocarcinoma . World J Clin Cases 2021; 9(7): 1563-1579
- URL: https://www.wjgnet.com/2307-8960/full/v9/i7/1563.htm
- DOI: https://dx.doi.org/10.12998/wjcc.v9.i7.1563


