Copyright
©The Author(s) 2021.
World J Clin Cases. Mar 6, 2021; 9(7): 1563-1579
Published online Mar 6, 2021. doi: 10.12998/wjcc.v9.i7.1563
Published online Mar 6, 2021. doi: 10.12998/wjcc.v9.i7.1563
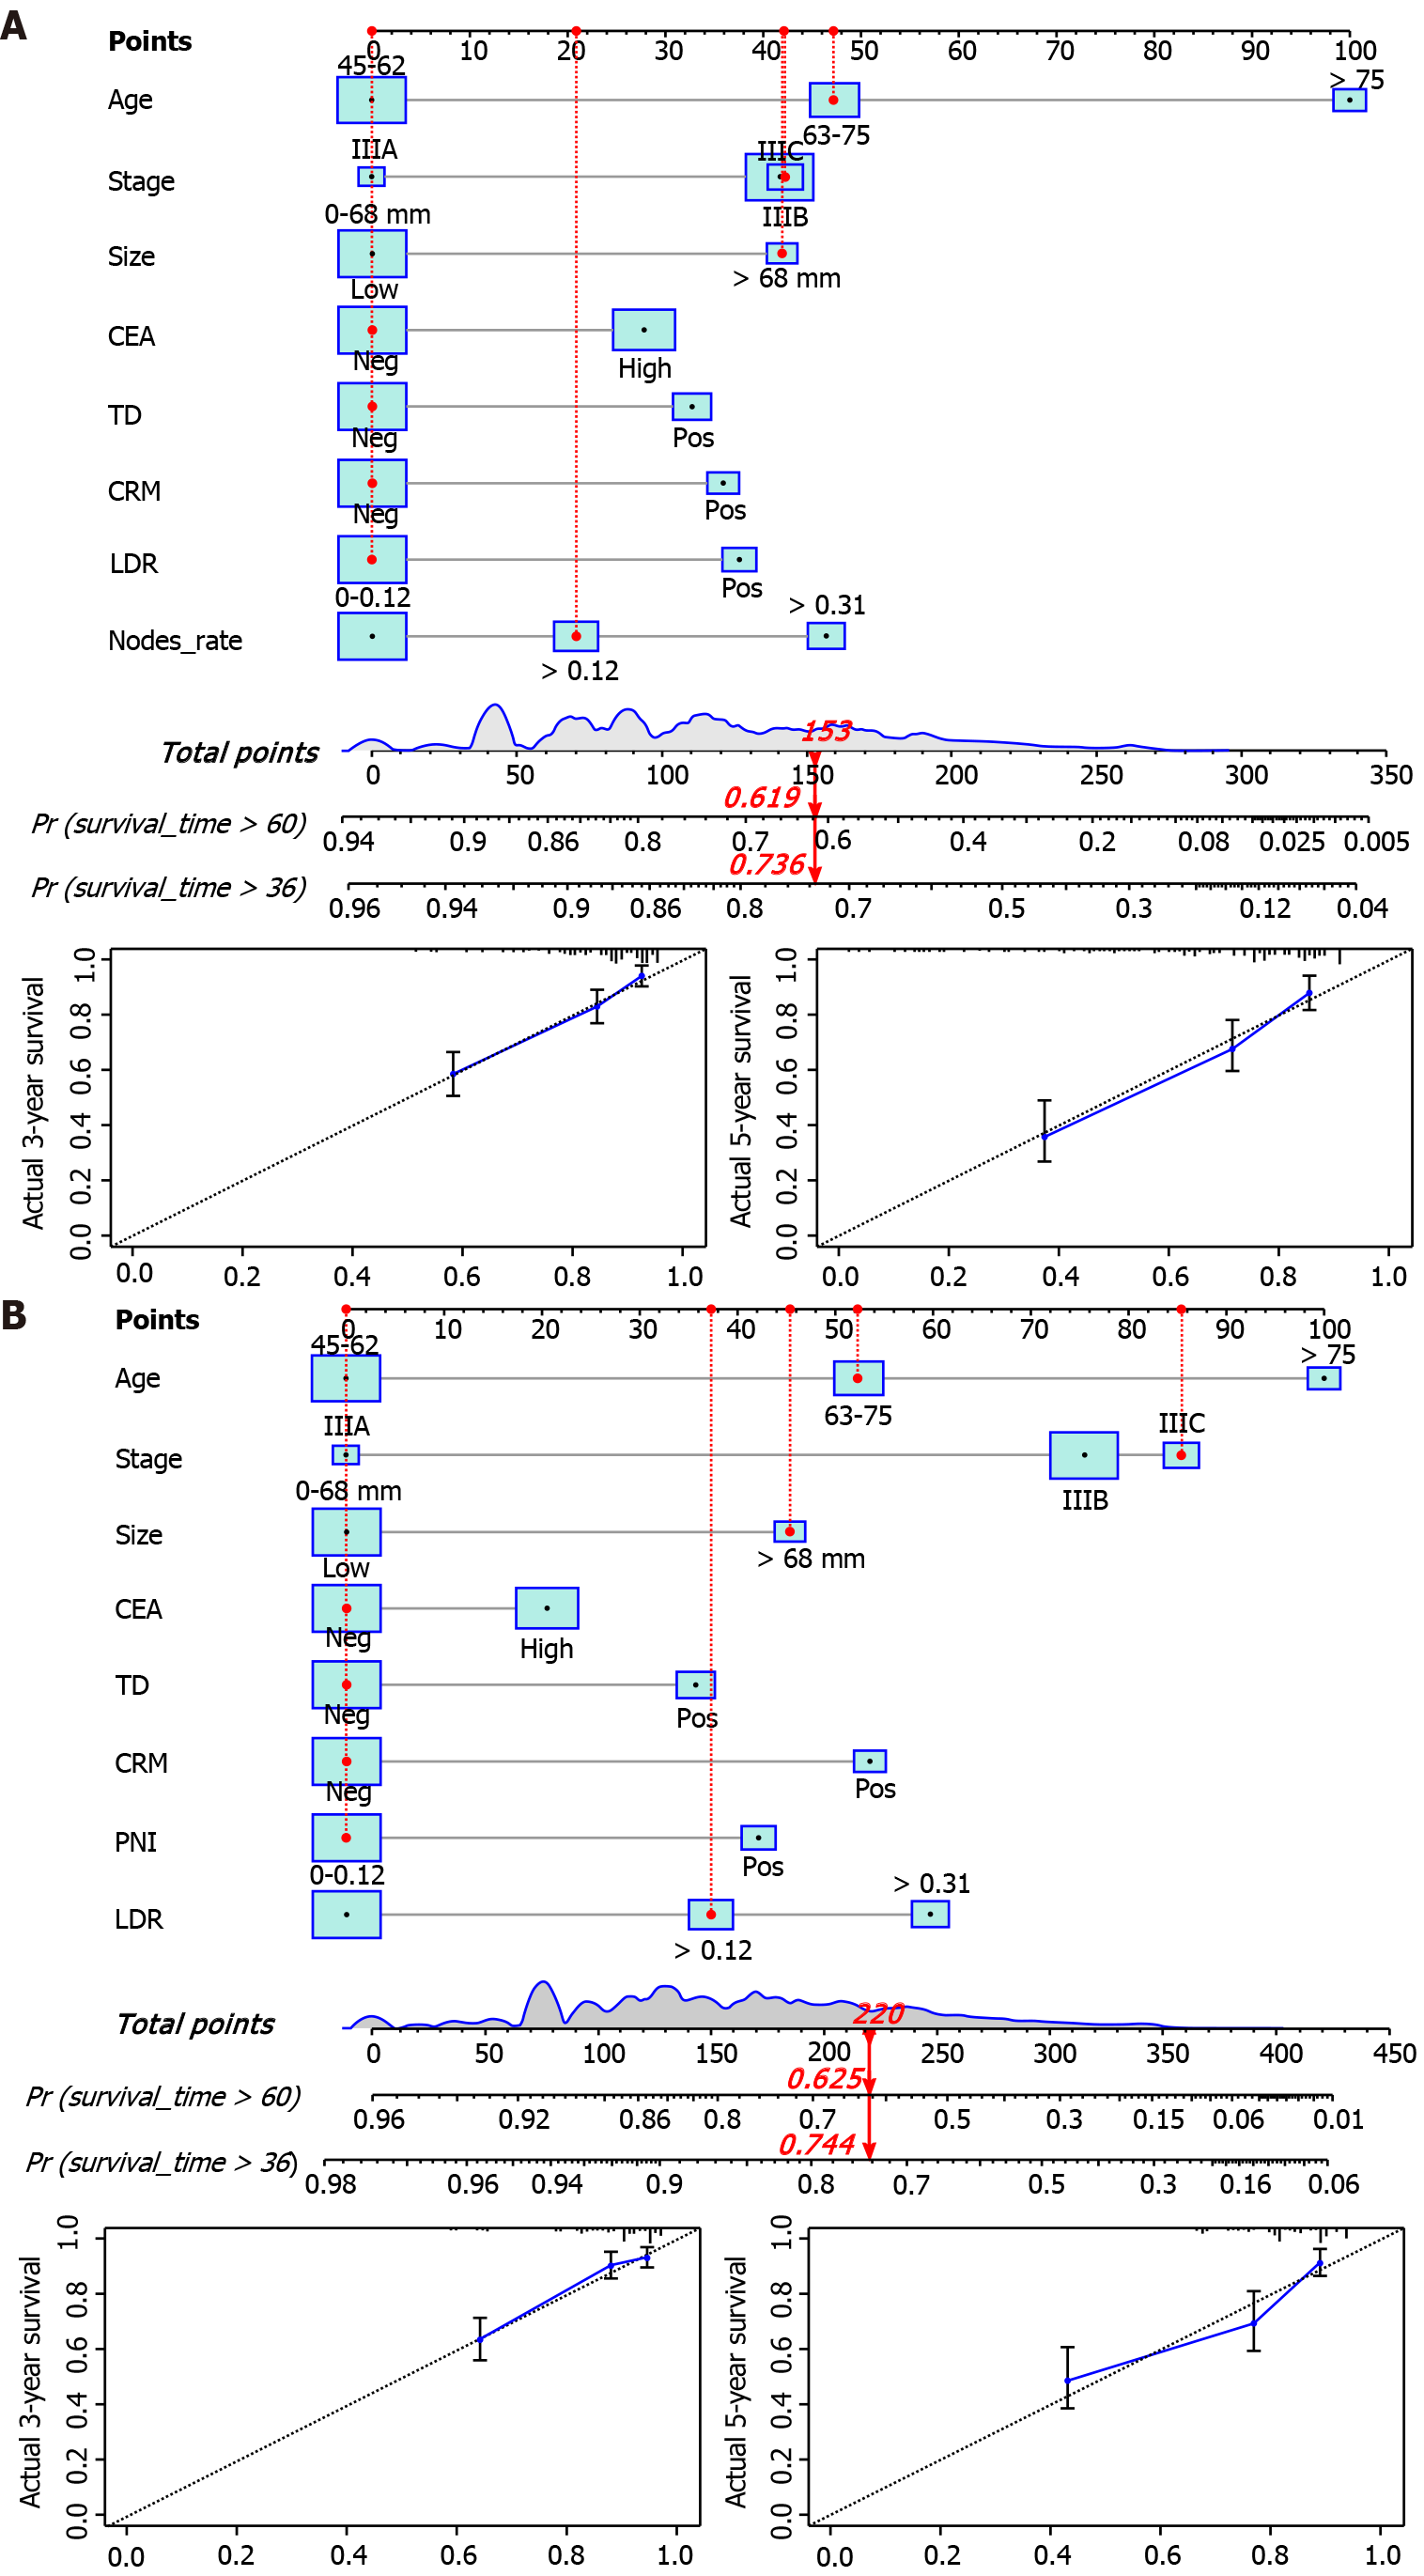
Figure 2 Overall survival nomogram, cancer-specific survival nomogram and verification cohorts calibration curve.
The total score obtained by summing the individual scores of the predictors was used to predict the 3- and 5-year survival rates of the patients. The calibration curve showed a high degree of agreement between the predicted and actual values of the overall survival (OS) nomogram and the cancer-specific survival (CSS) nomogram. A: OS nomogram and calibration curve B: CSS nomogram and calibration curve. (Example: 70-year-old male patient with rectal adenocarcinoma, tumor size 80 mm, circumferential resection margin (-), tumor engraftment (-), carcinoembryonic antigen (-), perineural invasion (-), clinical stage IIIC, LNR: 0.18. The red indicator line in the figure represents the score of patients: OS total score 153, 3-year OS: 0.619, 5-year OS: 0.736; CSS total score 220, 3-year CSS: 0.744, 5-year CSS: 0.625). CEA: Carcinoembryonic antigen; TD: Tumor engraftment; CRM: Circumferential resection margin; PNI: Perineural invasion; LDR: Low-dose-rate.
- Citation: Liu H, Li Y, Qu YD, Zhao JJ, Zheng ZW, Jiao XL, Zhang J. Construction of a clinical survival prognostic model for middle-aged and elderly patients with stage III rectal adenocarcinoma . World J Clin Cases 2021; 9(7): 1563-1579
- URL: https://www.wjgnet.com/2307-8960/full/v9/i7/1563.htm
- DOI: https://dx.doi.org/10.12998/wjcc.v9.i7.1563


