Copyright
©The Author(s) 2021.
World J Clin Cases. Dec 16, 2021; 9(35): 10884-10898
Published online Dec 16, 2021. doi: 10.12998/wjcc.v9.i35.10884
Published online Dec 16, 2021. doi: 10.12998/wjcc.v9.i35.10884
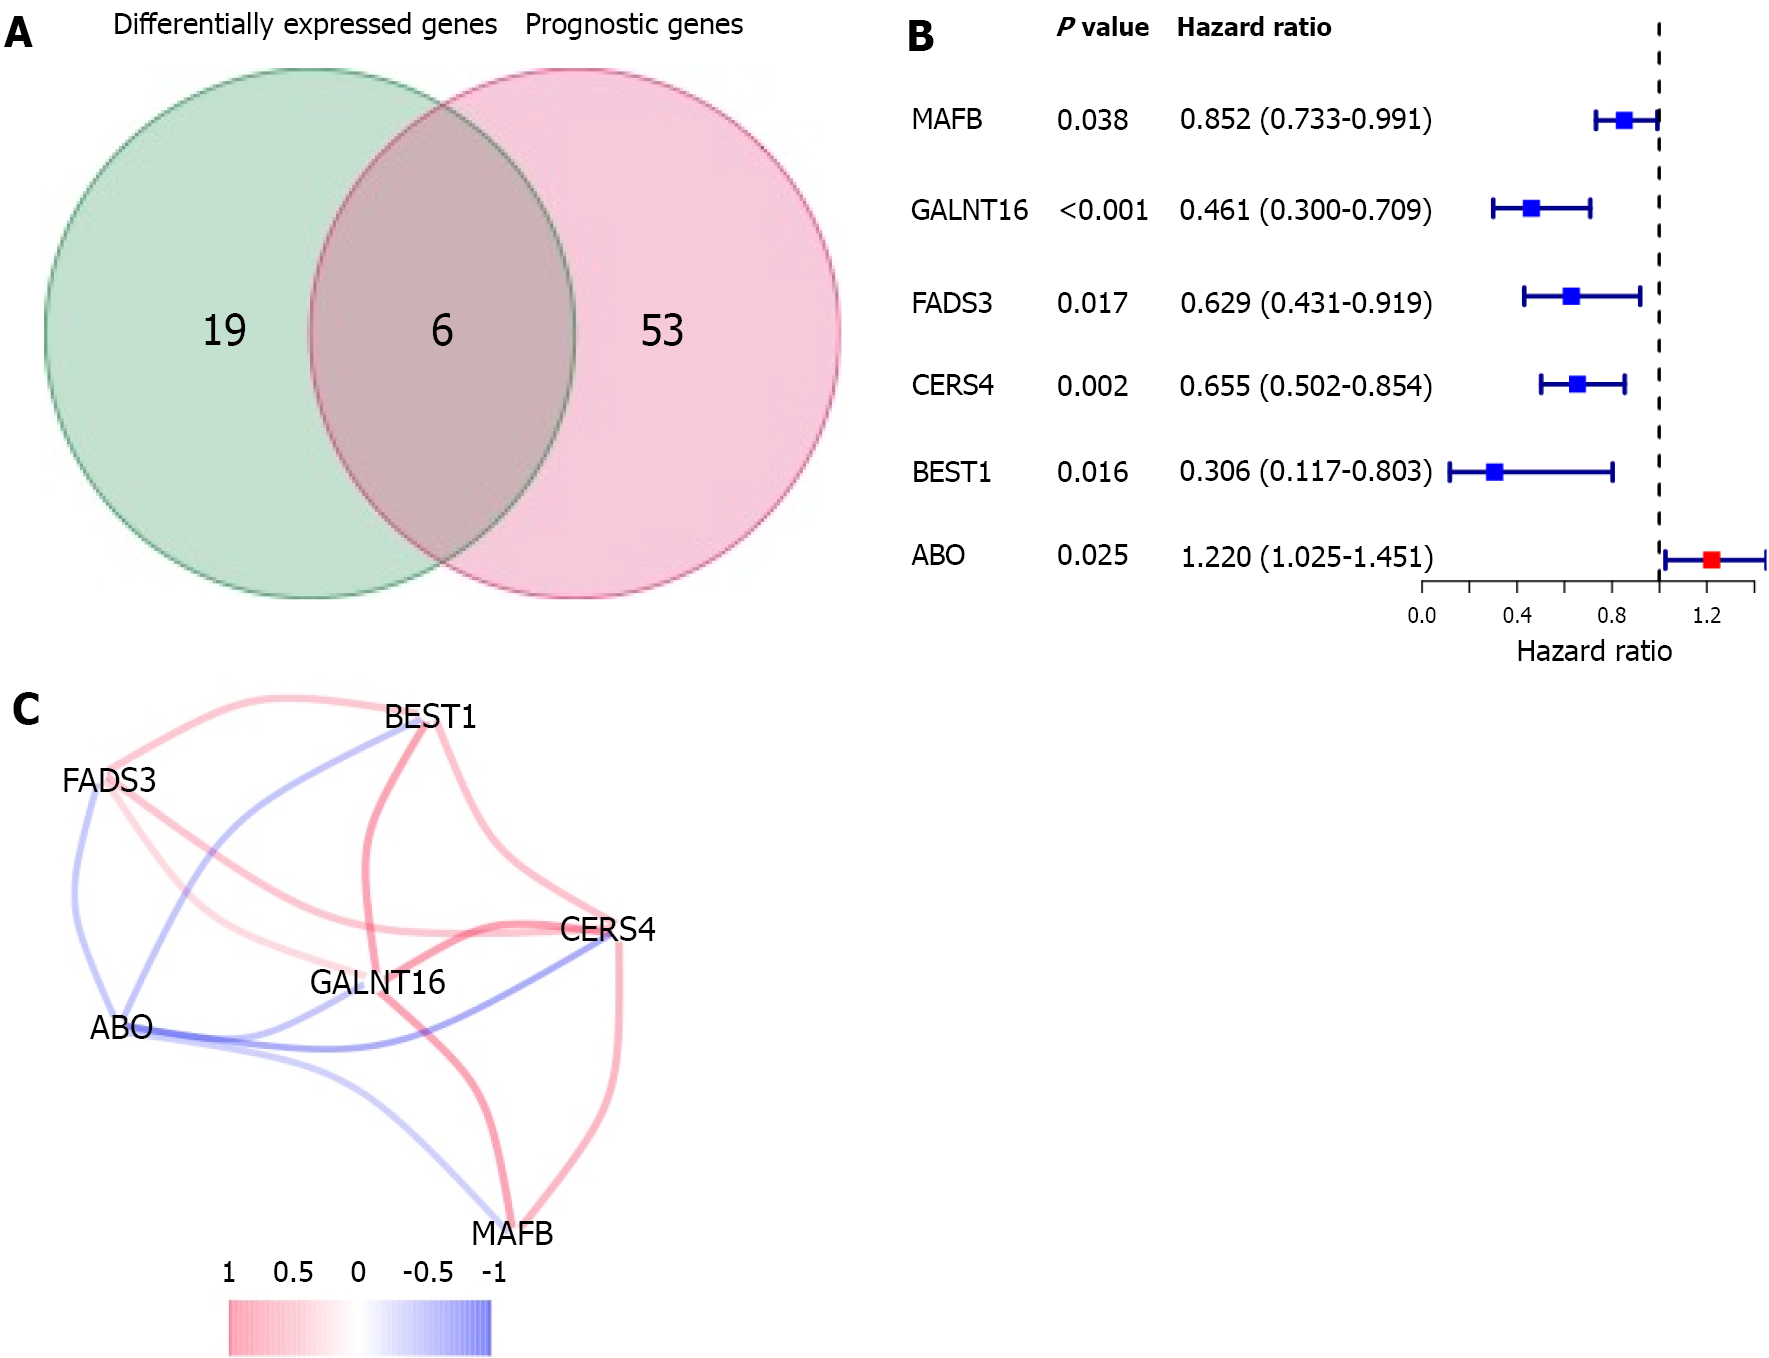
Figure 3 Candidate genes related to lipid metabolism in The Cancer Genome Atlas.
A: Venn diagrams were used to identify differentially expressed genes associated with overall survival between tumor tissues and adjacent normal tissues; B: The forest plot shows the relationship between gene expression and overall survival by univariate Cox regression analysis; C: Correlation coefficients in the correlation network of candidate genes are shown in different colors.
- Citation: Xu H, Sun J, Zhou L, Du QC, Zhu HY, Chen Y, Wang XY. Development of a lipid metabolism-related gene model to predict prognosis in patients with pancreatic cancer. World J Clin Cases 2021; 9(35): 10884-10898
- URL: https://www.wjgnet.com/2307-8960/full/v9/i35/10884.htm
- DOI: https://dx.doi.org/10.12998/wjcc.v9.i35.10884


