Copyright
©The Author(s) 2021.
World J Clin Cases. Dec 16, 2021; 9(35): 10884-10898
Published online Dec 16, 2021. doi: 10.12998/wjcc.v9.i35.10884
Published online Dec 16, 2021. doi: 10.12998/wjcc.v9.i35.10884
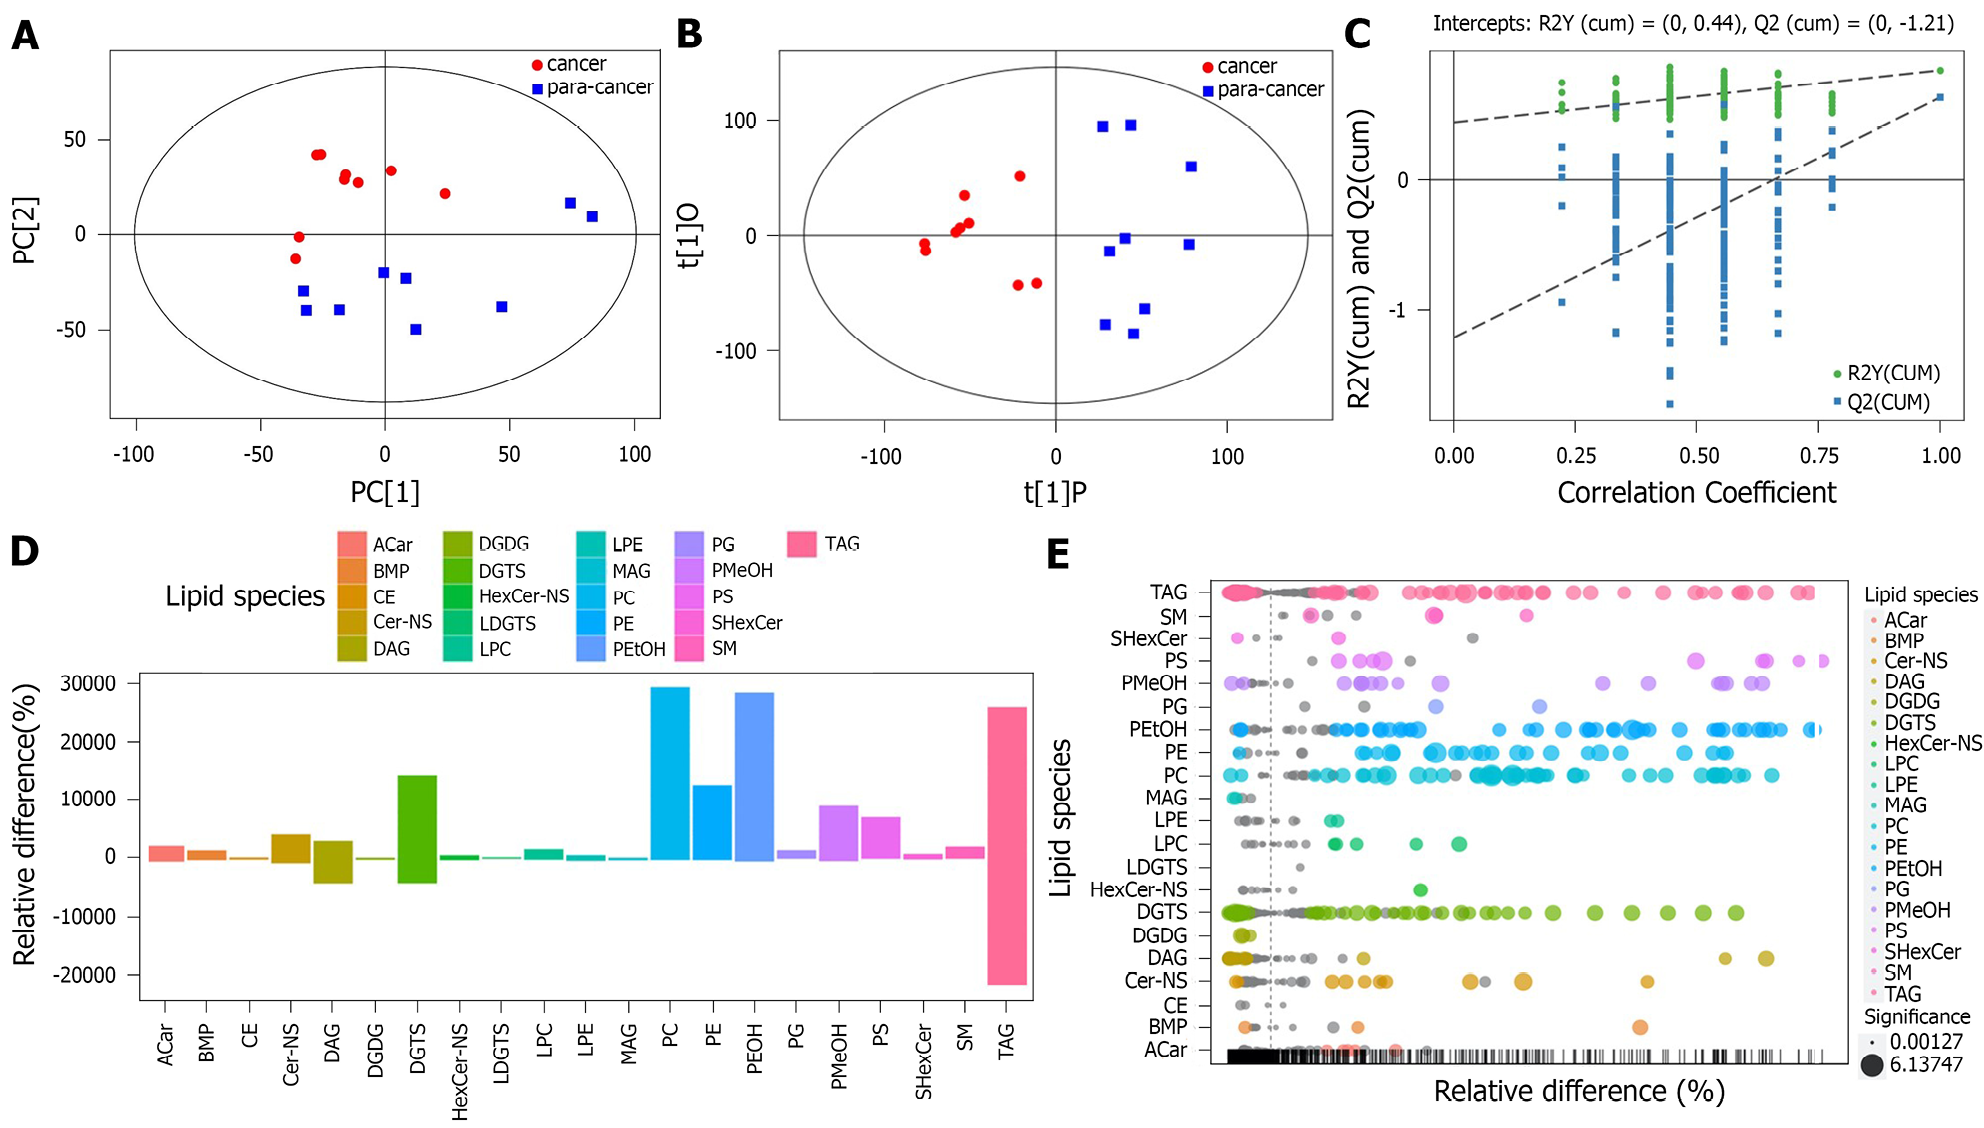
Figure 1 Identification of differential lipid metabolites.
A: Score scatter plot of the PCA model for the cancer group vs. the paracarcinoma tissue group; B: Score scatter plot of the orthogonal projections to latent structures-discriminant analysis (OPLS-DA) model for the cancer group vs. the paracancer group; C: Permutation test of the OPLS-DA model for the cancer group vs. the para-cancer group; D: Bar plot for the cancer group vs. the paracancer group. TAG: triacylglycerols; SM: sphingomyelin; SHeXcer: sulfatide; PS: phosphatidylserines; PMeOH: phosphatidylmethanol; PG: phosphatidylglycerols; PEtOH: phosphatidylethanol; PE: phosphatidylethanolamines; PC: phosphatidylcholines; MAG: myelin-associated glycoprotein; LPE: lyso-PE; LPC: lyso-PC; LDGTS: lyso-DGTS; HexCer: hexosylceramide; ACar: acaraben; DGTS: diacylglyceryl trimethylhomoserine; DGDG: digalactosyl diacylglycerols; DAG: diacylglycerols; Cer: ceramide; CE: cholesteryl esters; BMP: bis(monoacylglycerol)phosphate.
- Citation: Xu H, Sun J, Zhou L, Du QC, Zhu HY, Chen Y, Wang XY. Development of a lipid metabolism-related gene model to predict prognosis in patients with pancreatic cancer. World J Clin Cases 2021; 9(35): 10884-10898
- URL: https://www.wjgnet.com/2307-8960/full/v9/i35/10884.htm
- DOI: https://dx.doi.org/10.12998/wjcc.v9.i35.10884


