Copyright
©The Author(s) 2021.
World J Clin Cases. Nov 6, 2021; 9(31): 9670-9679
Published online Nov 6, 2021. doi: 10.12998/wjcc.v9.i31.9670
Published online Nov 6, 2021. doi: 10.12998/wjcc.v9.i31.9670
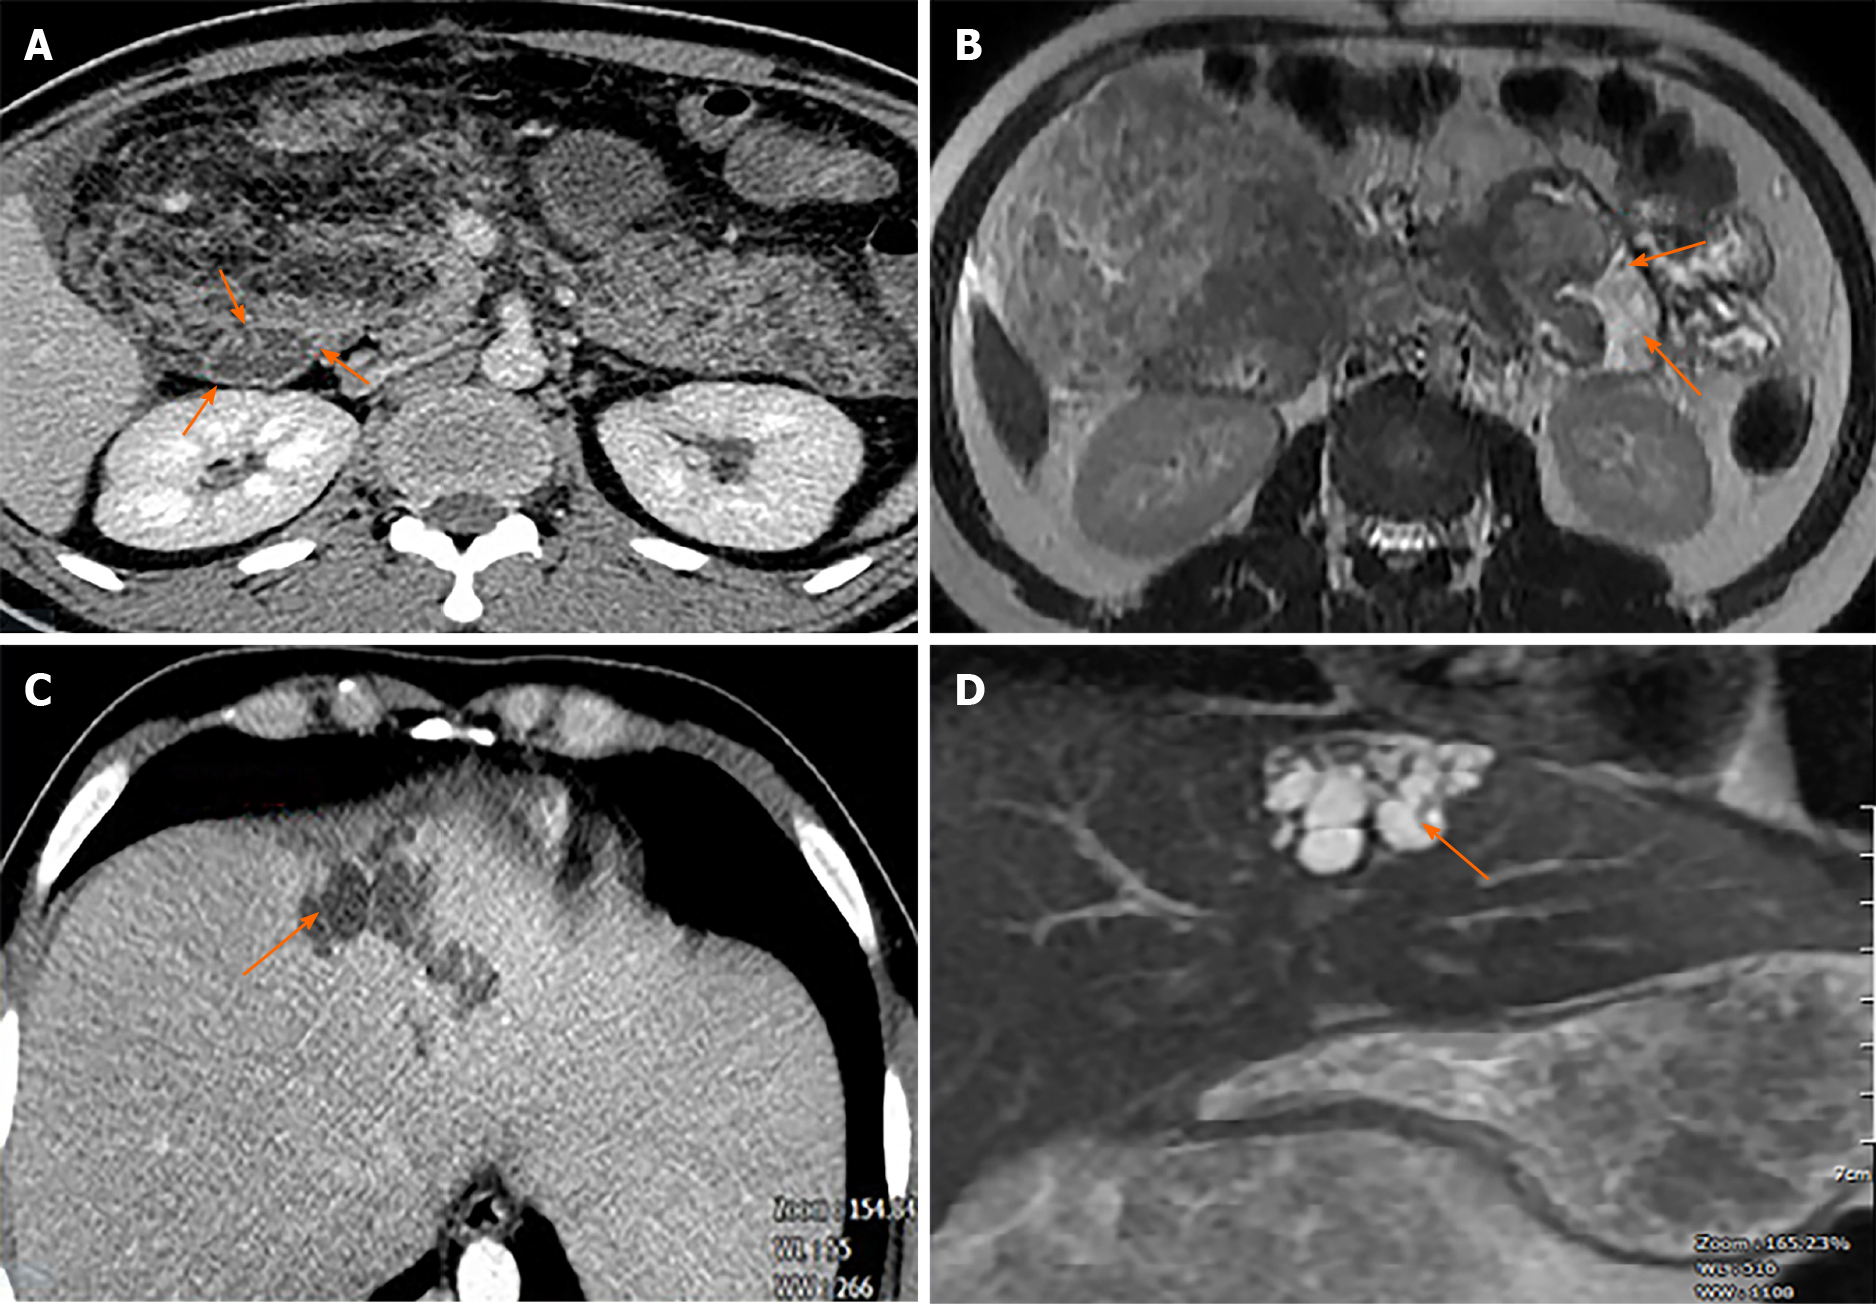
Figure 2 Contrast-enhanced computed tomography (CECT) and magnetic resonance imaging (MRI).
A: CECT showing fatty tissue infiltration into duodenal wall (orange arrows); B: MRI also showed fatty tissue infiltration into duodenal wall (orange arrows); C: CECT scan showed hypoechoic saccular dilatations in segment IV of the liver; D: T2-weighted MRI showed segmental biliary ectasia (arrow).
- Citation: Nguyen LC, Vu KT, Vo TTT, Trinh CH, Do TD, Pham NTV, Pham TV, Nguyen TT, Nguyen HC, Byeon JS. Brunner’s gland hyperplasia associated with lipomatous pseudohypertrophy of the pancreas presenting with gastrointestinal bleeding: A case report. World J Clin Cases 2021; 9(31): 9670-9679
- URL: https://www.wjgnet.com/2307-8960/full/v9/i31/9670.htm
- DOI: https://dx.doi.org/10.12998/wjcc.v9.i31.9670


