Copyright
©The Author(s) 2021.
World J Clin Cases. Nov 6, 2021; 9(31): 9652-9661
Published online Nov 6, 2021. doi: 10.12998/wjcc.v9.i31.9652
Published online Nov 6, 2021. doi: 10.12998/wjcc.v9.i31.9652
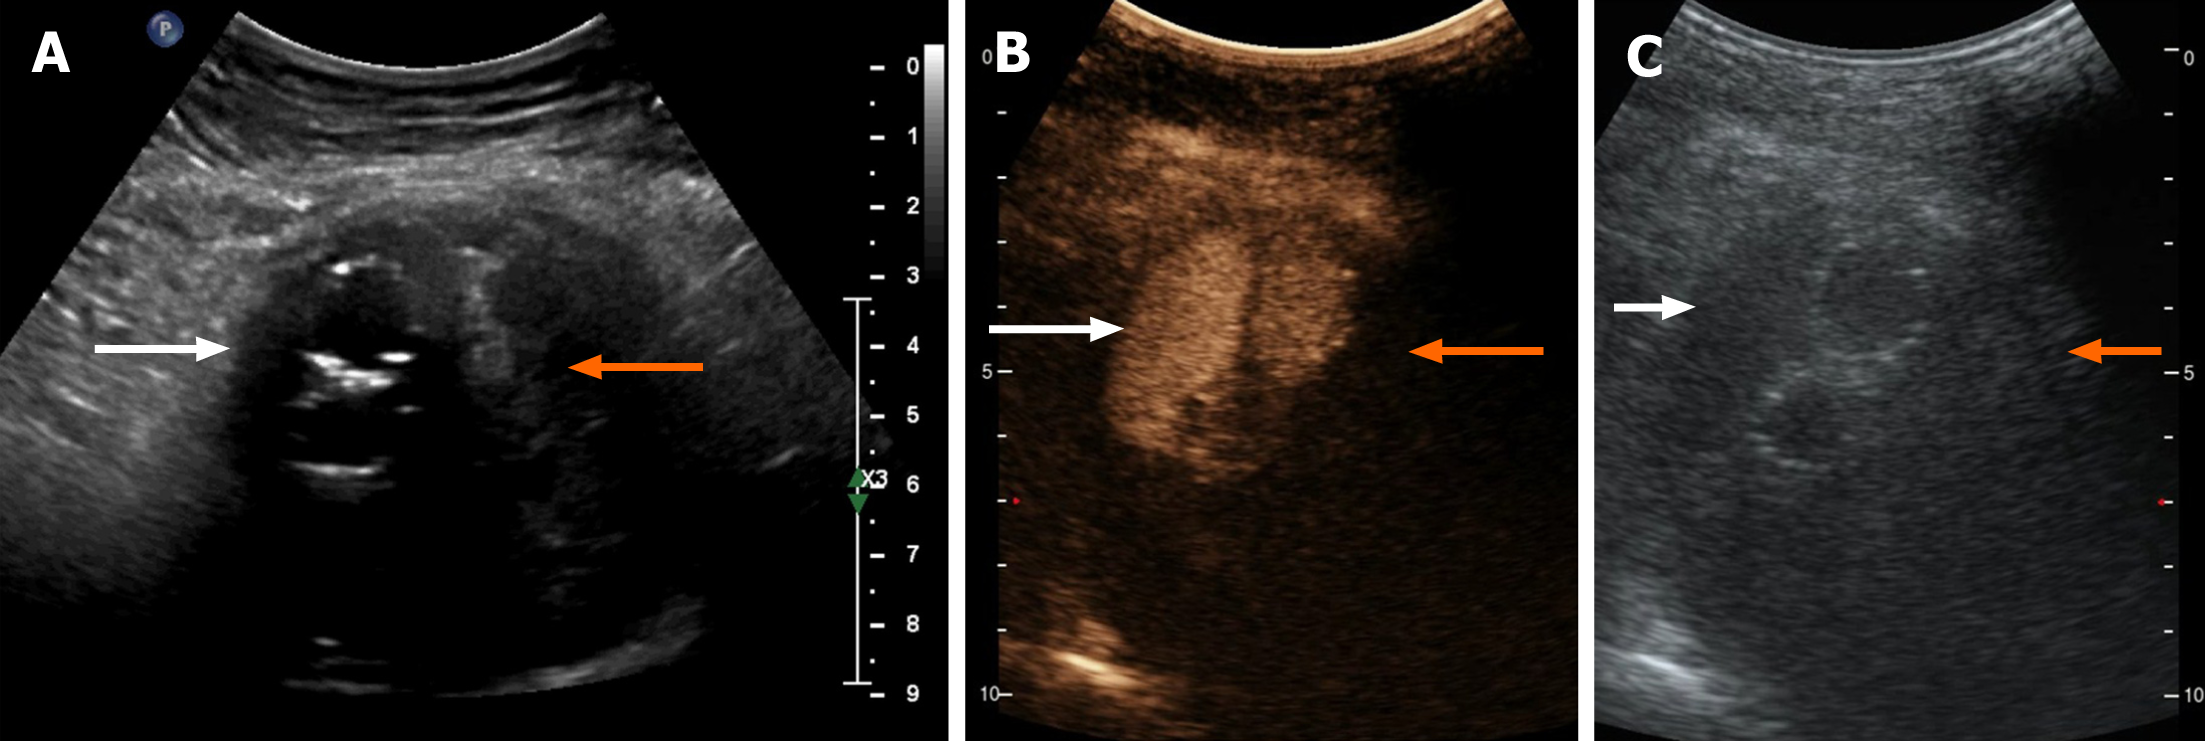
Figure 5 Typical Type 2 endoleak contrast-enhanced ultrasonography findings.
A-C: The areas referred to by the white arrows are approximately the same anatomical location, as are the areas referred to by the orange arrows. A: Two-dimensional ultrasound image. The region pointed to by the white arrows are hypoechoic areas presumed to be flowing blood, and the areas pointed to by the orange arrows indicate patchy hyperechoic areas presumed to be clotted thrombi; B: Synchronous contrast-enhanced ultrasonography (CEUS) pictures indicating the harmonic mode, in which the contrast signal was highlighted. The areas pointed to by the white arrows indicate the fascicular contrast signal presumed to be flowing blood with rich contrast medium. The areas pointed to by the orange arrows have no contrast signal and are presumed to have very little blood supply; C: Synchronous CEUS pictures indicating the basal mode, in which only the tissue signal was displayed similar to a normal ultrasound and the contrast agent signal was not highlighted. The areas pointed to by the white arrow are hypoechoic areas, and the area indicated by the orange arrow has a patchy hyperechoic area. Comparing B and C, it could be seen that the contrast medium filled the hypoechoic area in bundles.
- Citation: Xie XJ, Jiang TA, Zhao QY. Diagnostic value of contrast-enhanced ultrasonography in mediastinal leiomyosarcoma mimicking aortic hematoma: A case report and review of literature . World J Clin Cases 2021; 9(31): 9652-9661
- URL: https://www.wjgnet.com/2307-8960/full/v9/i31/9652.htm
- DOI: https://dx.doi.org/10.12998/wjcc.v9.i31.9652


