Copyright
©The Author(s) 2021.
World J Clin Cases. Nov 6, 2021; 9(31): 9564-9570
Published online Nov 6, 2021. doi: 10.12998/wjcc.v9.i31.9564
Published online Nov 6, 2021. doi: 10.12998/wjcc.v9.i31.9564
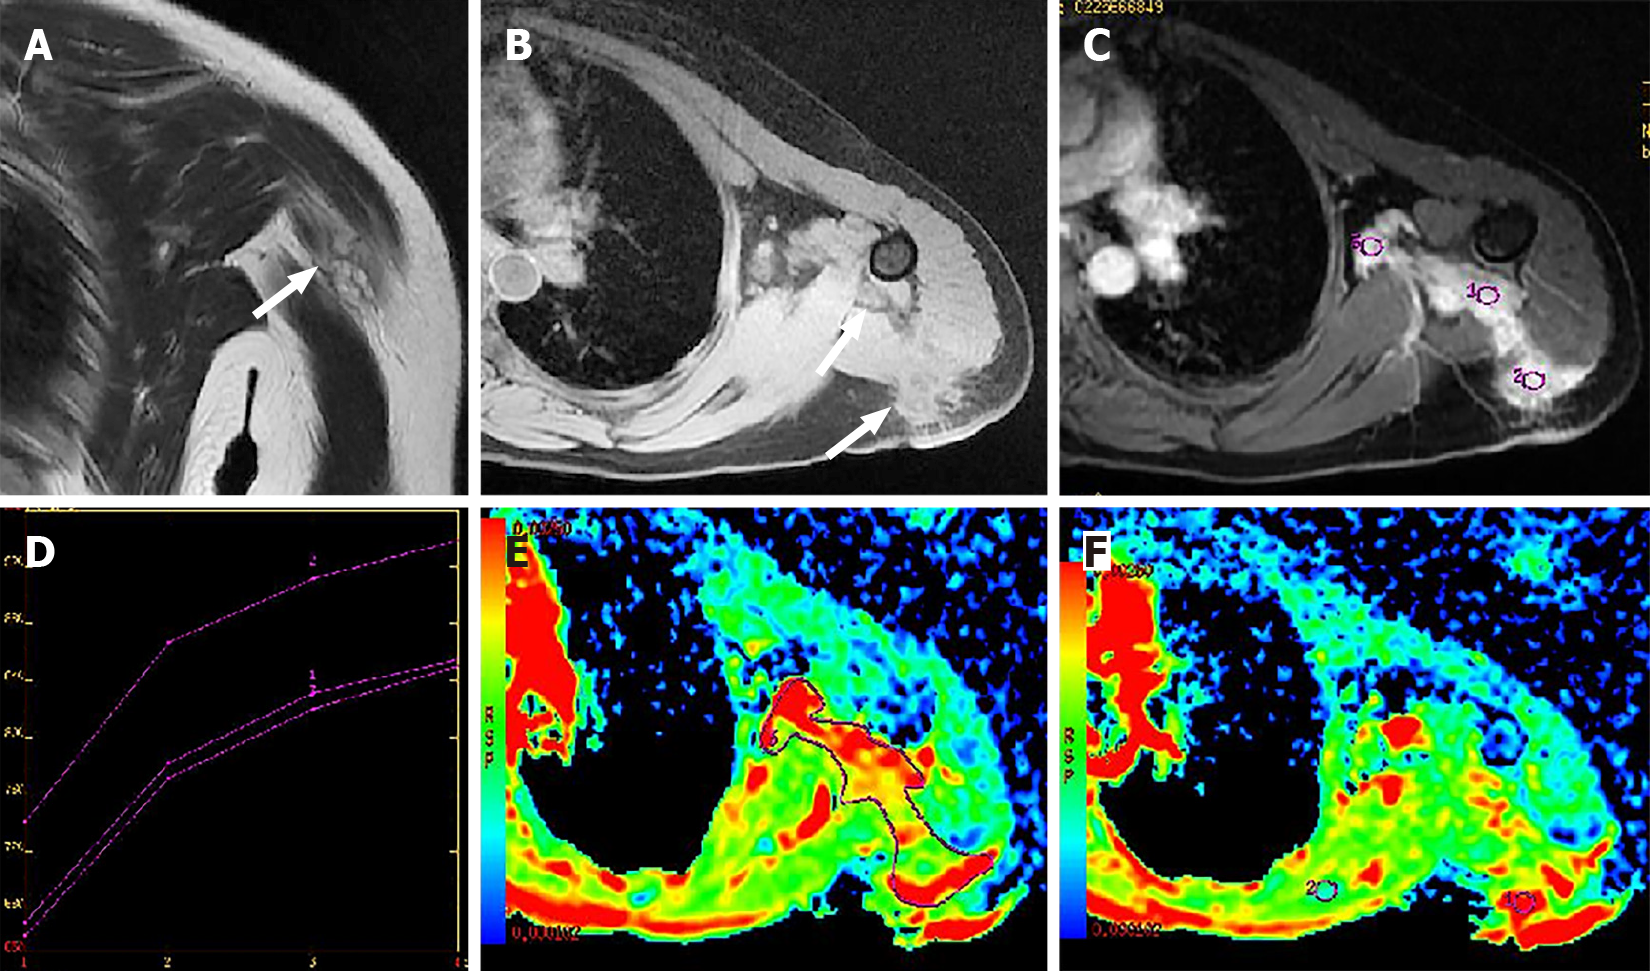
Figure 2 On morphological magnetic resonance images.
Iso- to hyper-intensity of the mass (white arrow) on the coronal T2-weighted without fat saturation image (A) and hypo- to iso-intensity (white arrow) on the axial T1 FSPGR (pre-contrast enhancement) (B) are shown compared to signal intensity. Axial T1 3D FSPGR LAVA sequence shows multiple nodular enhancements with irregular shapes and blurred margins (ROI1, 2, 3) (C). TIC of the mass presents as a slow-increased trend (D). The lesion on DWI was hyperintense with a higher mean ADC value of 2.19 × 10⁻³ mm2/s (E, ROI 3) than surrounding normal soft tissues (1.03 × 10⁻³ mm2/s) (F, ROI2).
- Citation: Kang JY, Zhang K, Liu AL, Wang HL, Zhang LN, Liu WV. Characteristics of primary giant cell tumor in soft tissue on magnetic resonance imaging: A case report. World J Clin Cases 2021; 9(31): 9564-9570
- URL: https://www.wjgnet.com/2307-8960/full/v9/i31/9564.htm
- DOI: https://dx.doi.org/10.12998/wjcc.v9.i31.9564


