Copyright
©The Author(s) 2021.
World J Clin Cases. Nov 6, 2021; 9(31): 9440-9451
Published online Nov 6, 2021. doi: 10.12998/wjcc.v9.i31.9440
Published online Nov 6, 2021. doi: 10.12998/wjcc.v9.i31.9440
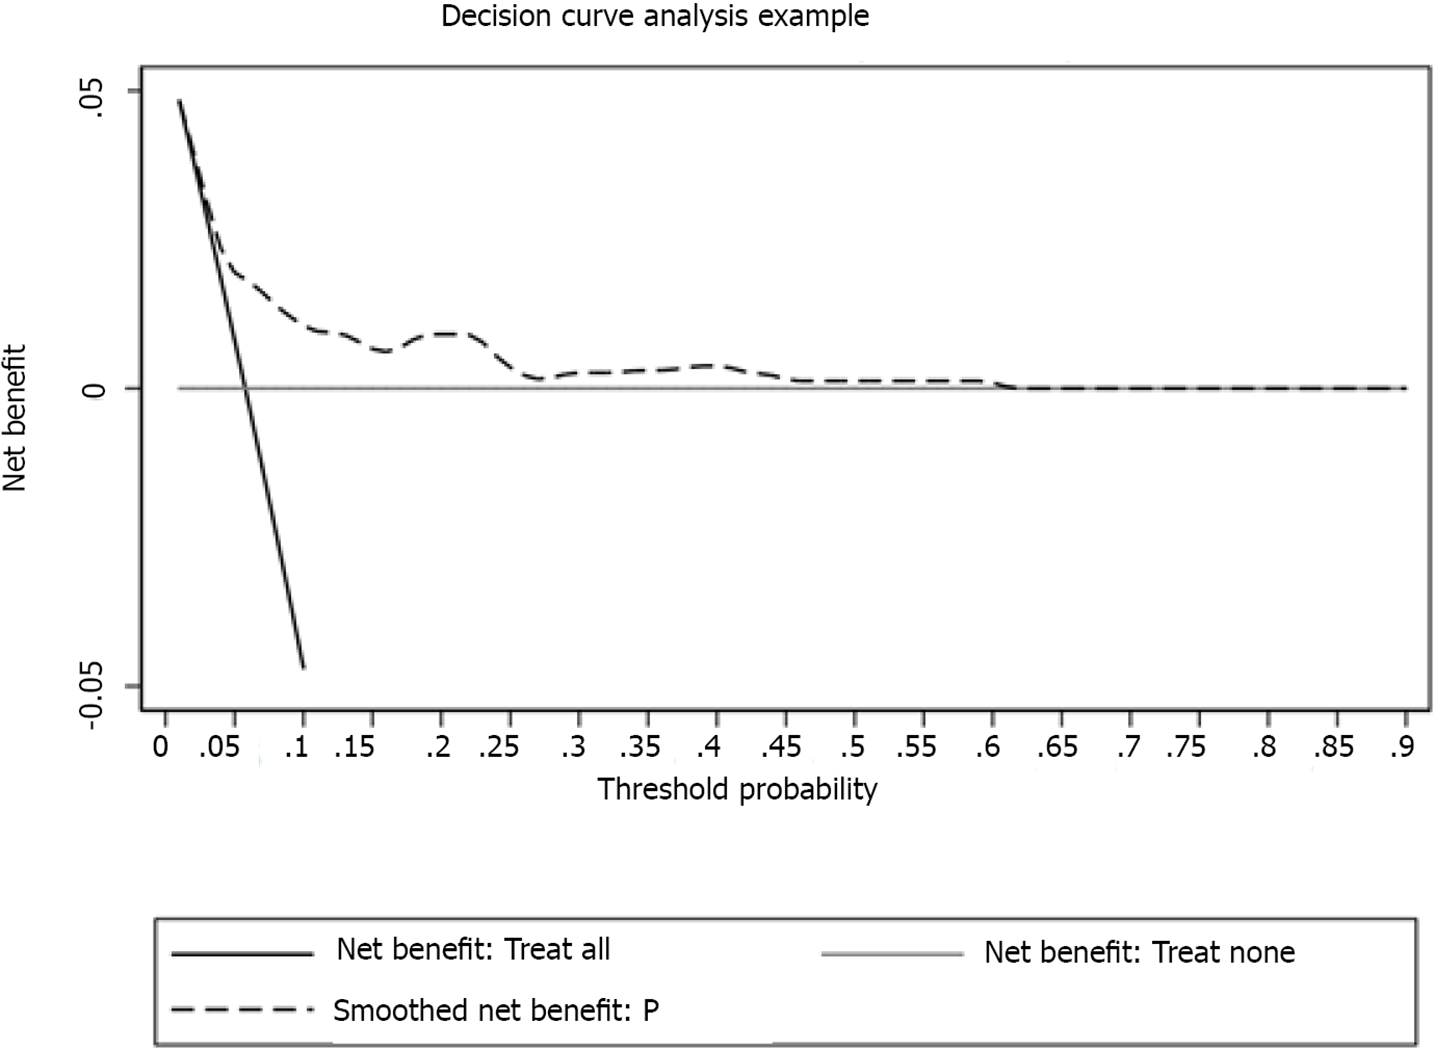
Figure 6 Decision curve analysis assessment of the nonadherence nomogram.
The y-axis measures the net benefit, whereas the dotted line represents relapse after minor ischemic stroke risk in the nomogram. The thin solid line represents the assumption that relapse had occurred in none of the patients during their hospitalization. The thin thick solid line represents the assumption that all patients had relapsed during their hospitalization. The decision curve shows that at threshold probabilities of a patient and a doctor of 5% and 60%, respectively, using the nomogram developed in the present study to predict relapse during hospitalization after minor ischemic stroke risk adds more benefit than the intervention-all-patients scheme or the intervention-none scheme.
- Citation: Yu XF, Yin WW, Huang CJ, Yuan X, Xia Y, Zhang W, Zhou X, Sun ZW. Risk factors for relapse and nomogram for relapse probability prediction in patients with minor ischemic stroke. World J Clin Cases 2021; 9(31): 9440-9451
- URL: https://www.wjgnet.com/2307-8960/full/v9/i31/9440.htm
- DOI: https://dx.doi.org/10.12998/wjcc.v9.i31.9440


