Copyright
©The Author(s) 2021.
World J Clin Cases. Oct 16, 2021; 9(29): 8671-8693
Published online Oct 16, 2021. doi: 10.12998/wjcc.v9.i29.8671
Published online Oct 16, 2021. doi: 10.12998/wjcc.v9.i29.8671
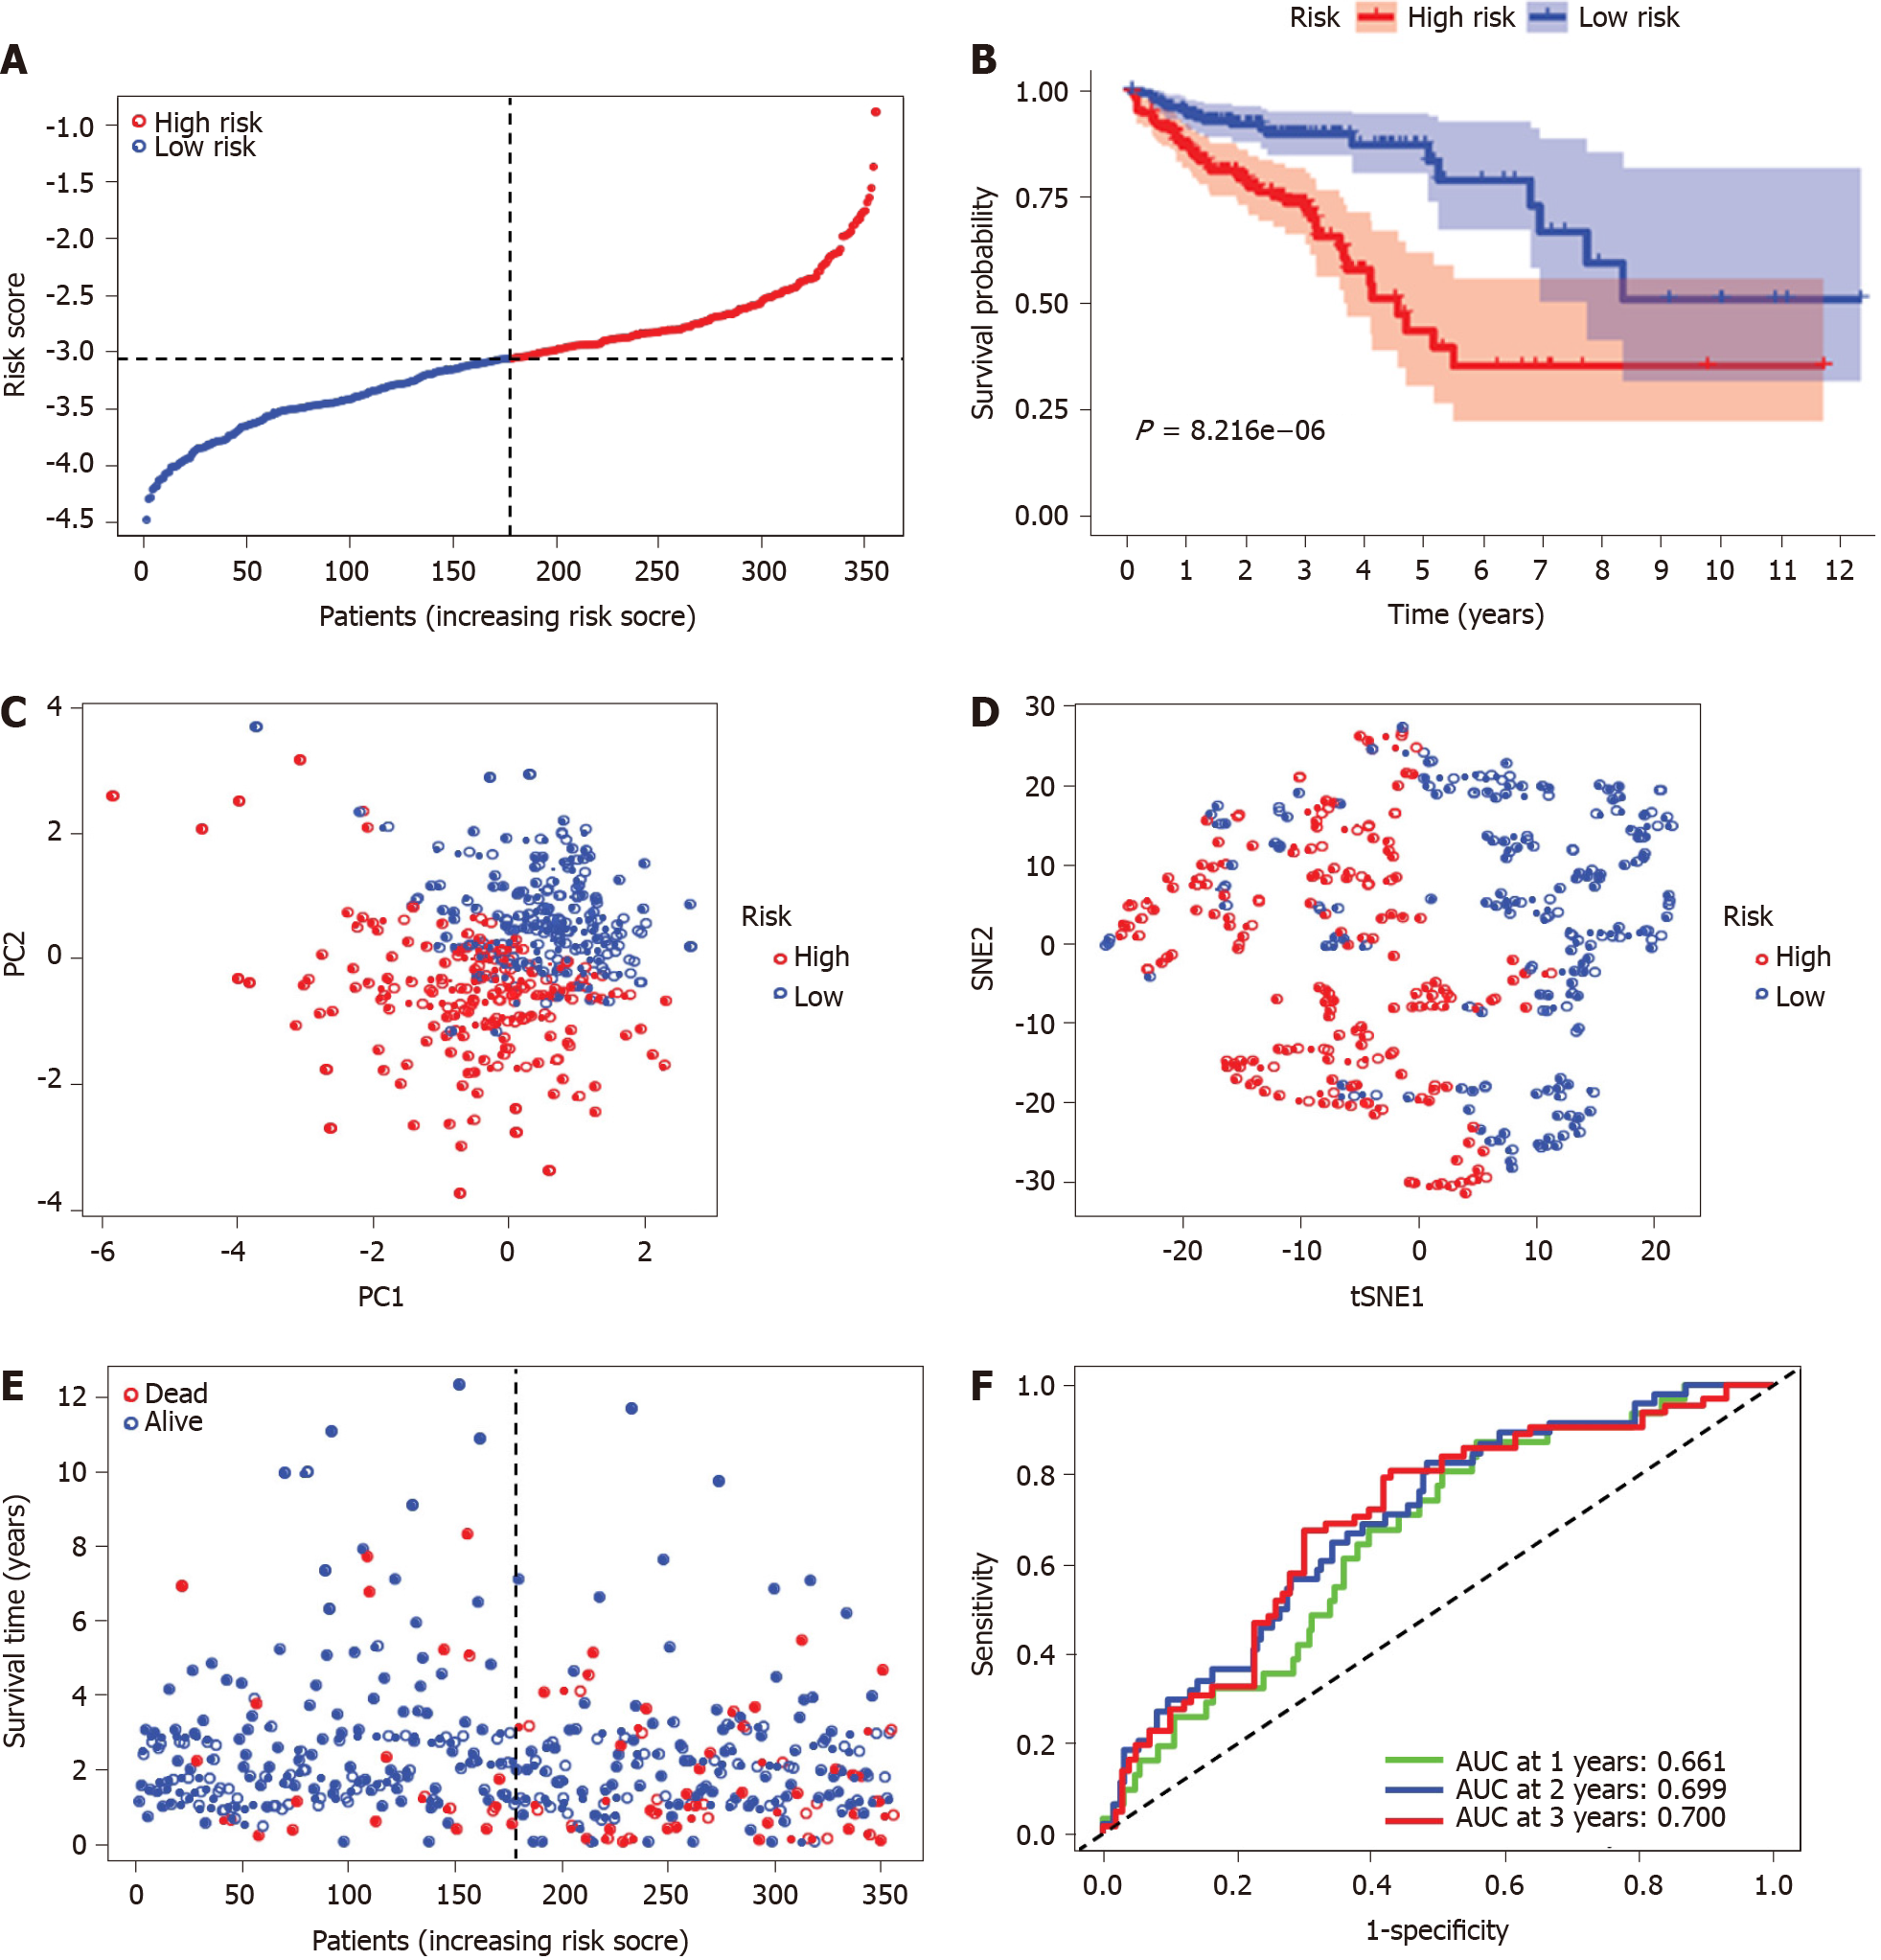
Figure 4 Prognostic analysis of the five ferroptosis-related gene models in the Cancer Genome Atlas-colon adenocarcinoma cohort.
A: Distribution and median value of the risk scores in the Cancer Genome Atlas-colon adenocarcinoma (TCGA-COAD) cohort. The black dotted line is the optimum cut-off dividing patients into high-risk and low-risk groups. The red curve represents high risk, and the blue curve represents low risk; B: Kaplan-Meier survival curves for the overall survival of patients in the high-risk group and low-risk group in the TCGA-COAD cohort; C: Principal component analysis plot of the TCGA-COAD cohort; D: t-distributed stochastic neighbor embedding analysis of the TCGA-COAD cohort; E: Distributions of overall survival status, overall survival, and risk score in the TCGA-COAD cohort. The red dot indicates patient death, and the blue dot indicates patient survival; F: Area under the curve values of time-dependent receiver operating characteristic curves verified the prognostic performance of the risk score in the TCGA-COAD cohort. PC: Principal component analysis; t-SNE: t-distributed stochastic neighbor embedding; AUC: Area under the curve.
- Citation: Miao YD, Kou ZY, Wang JT, Mi DH. Prognostic implications of ferroptosis-associated gene signature in colon adenocarcinoma. World J Clin Cases 2021; 9(29): 8671-8693
- URL: https://www.wjgnet.com/2307-8960/full/v9/i29/8671.htm
- DOI: https://dx.doi.org/10.12998/wjcc.v9.i29.8671


