Copyright
©The Author(s) 2021.
World J Clin Cases. Oct 6, 2021; 9(28): 8388-8403
Published online Oct 6, 2021. doi: 10.12998/wjcc.v9.i28.8388
Published online Oct 6, 2021. doi: 10.12998/wjcc.v9.i28.8388
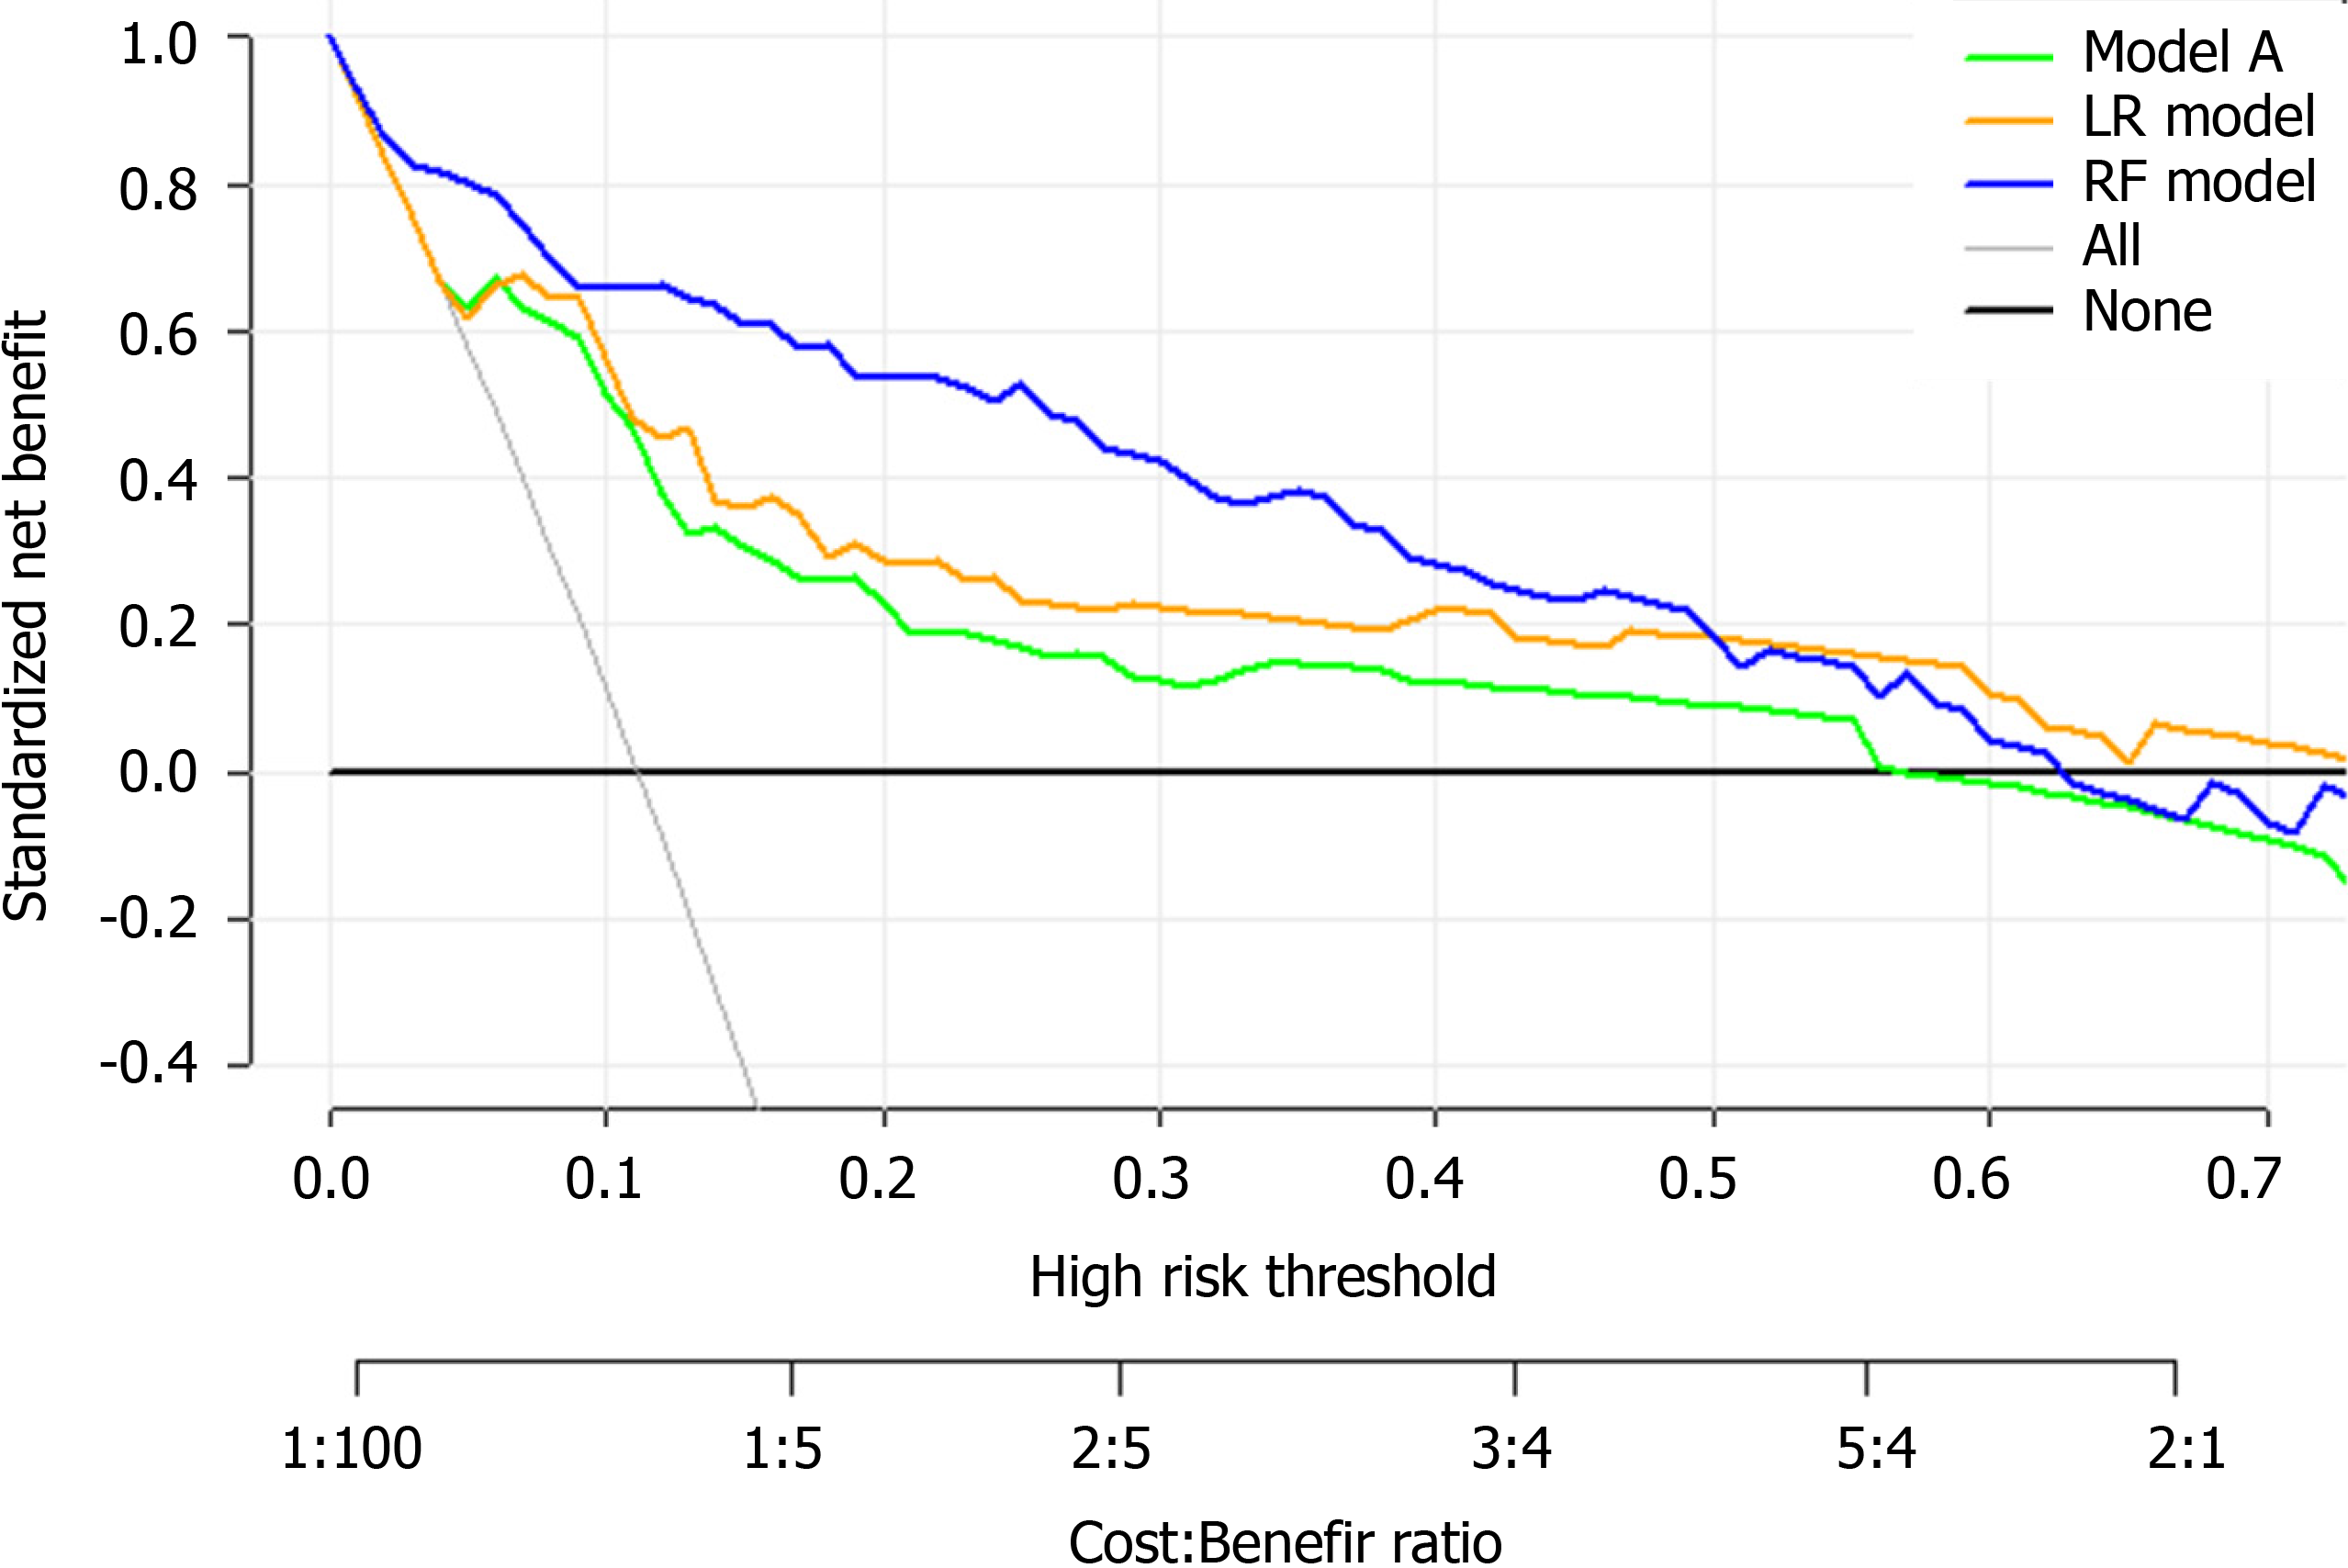
Figure 9 Decision curve analysis for the model A, logistic regression and random forest risk prediction models.
The vertical axis displays standardized net benefit. The two horizontal axes show the correspondence between high-risk threshold and cost: benefit ratio. The thin gray line is the standardized net benefit of allocating intensive care unit resources to all patients; the thick black line is the standardized net benefit of no intensive care unit admission. Decision curve analysis shows that our models had more significant standardized net benefits in the major threshold probabilities interval than model A, demonstrating that our models have better clinical benefit. LR: Logistic regression; RF: Random forest.
- Citation: Huang HF, Liu Y, Li JX, Dong H, Gao S, Huang ZY, Fu SZ, Yang LY, Lu HZ, Xia LY, Cao S, Gao Y, Yu XX. Validated tool for early prediction of intensive care unit admission in COVID-19 patients. World J Clin Cases 2021; 9(28): 8388-8403
- URL: https://www.wjgnet.com/2307-8960/full/v9/i28/8388.htm
- DOI: https://dx.doi.org/10.12998/wjcc.v9.i28.8388


