Copyright
©The Author(s) 2021.
World J Clin Cases. Oct 6, 2021; 9(28): 8388-8403
Published online Oct 6, 2021. doi: 10.12998/wjcc.v9.i28.8388
Published online Oct 6, 2021. doi: 10.12998/wjcc.v9.i28.8388
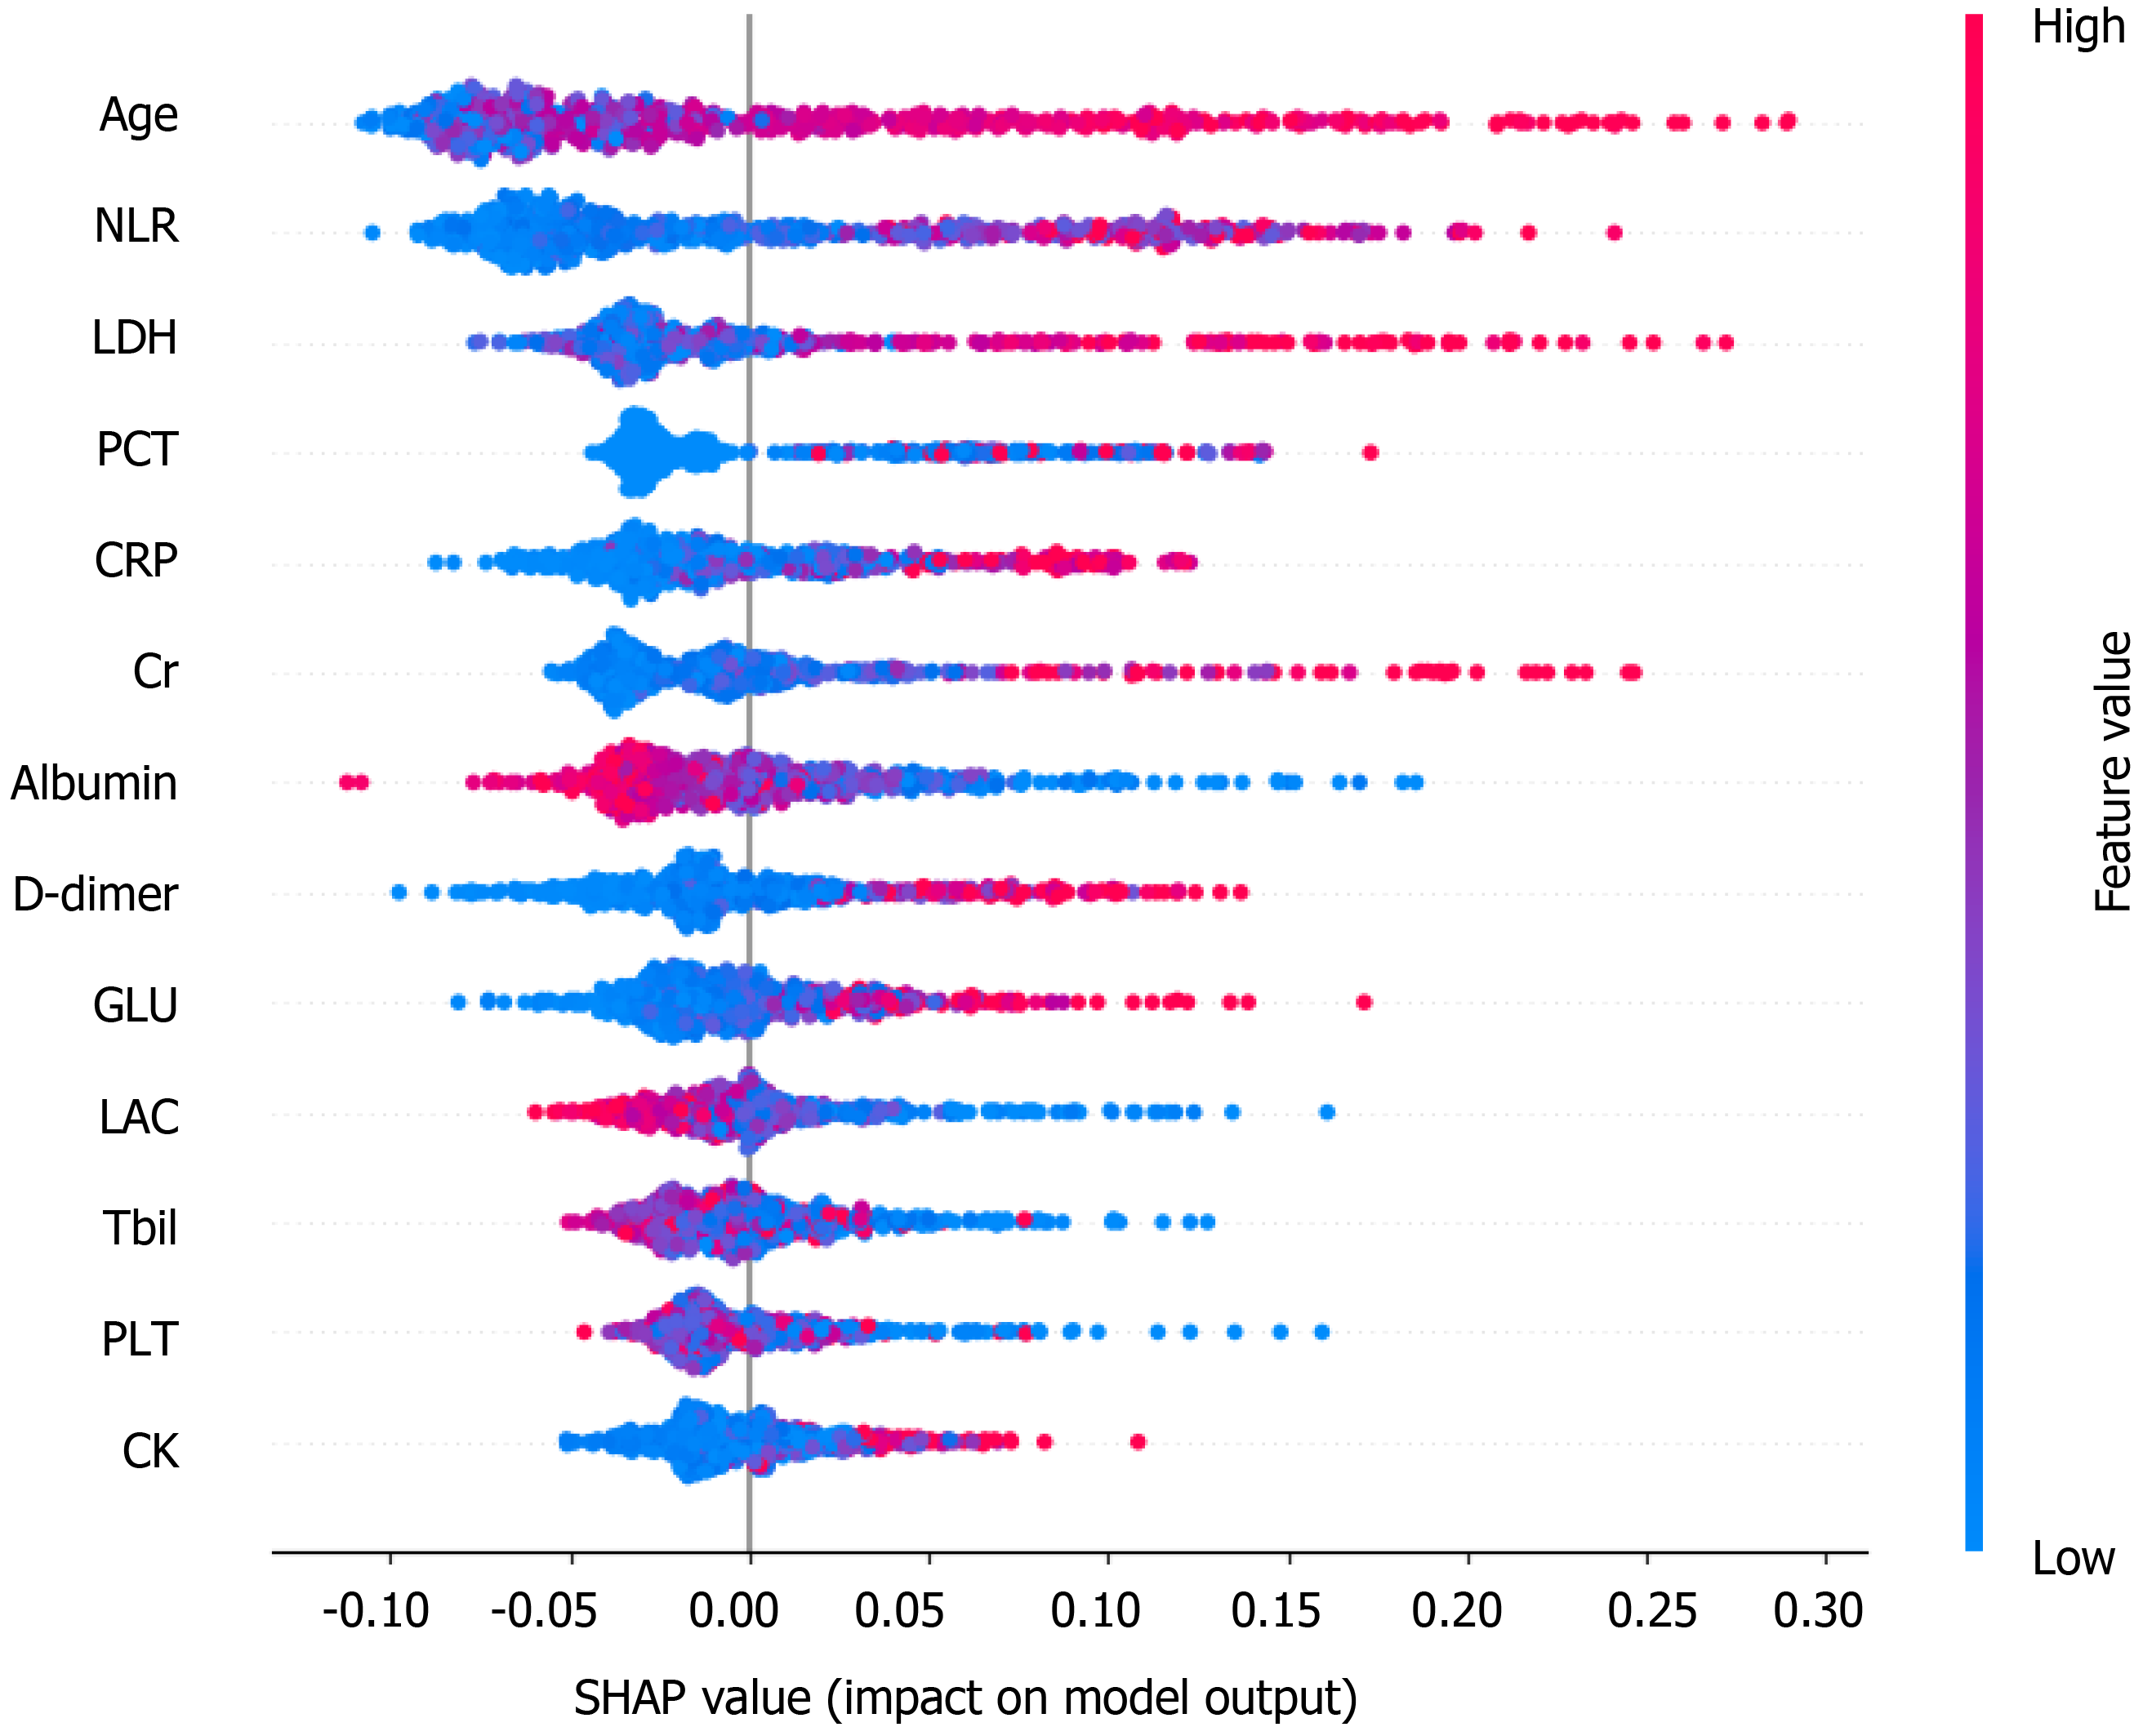
Figure 5 SHapley Additive exPlanations values of every feature used to train the random forest model for every sample.
Each dot corresponds to an individual person in the study. The dot’s position on the X axis shows the impact that feature has on the model’s prediction for that person. The color represents the feature value (red high, blue low). This reveals for example that an older age increases the predicted intensive care unit admission probability. CK: Creatine kinase; Cr: Creatinine; CRP: C-reactive protein; GLU: Glucose; LAC: Lactate; LDH: Lactate dehydrogenase; NLR: Neutrophil-to-lymphocyte ratio; PCT: Procalcitonin; PLT: Platelet; TBil: Total bilirubin.
- Citation: Huang HF, Liu Y, Li JX, Dong H, Gao S, Huang ZY, Fu SZ, Yang LY, Lu HZ, Xia LY, Cao S, Gao Y, Yu XX. Validated tool for early prediction of intensive care unit admission in COVID-19 patients. World J Clin Cases 2021; 9(28): 8388-8403
- URL: https://www.wjgnet.com/2307-8960/full/v9/i28/8388.htm
- DOI: https://dx.doi.org/10.12998/wjcc.v9.i28.8388


