Copyright
©The Author(s) 2021.
World J Clin Cases. Sep 16, 2021; 9(26): 7811-7817
Published online Sep 16, 2021. doi: 10.12998/wjcc.v9.i26.7811
Published online Sep 16, 2021. doi: 10.12998/wjcc.v9.i26.7811
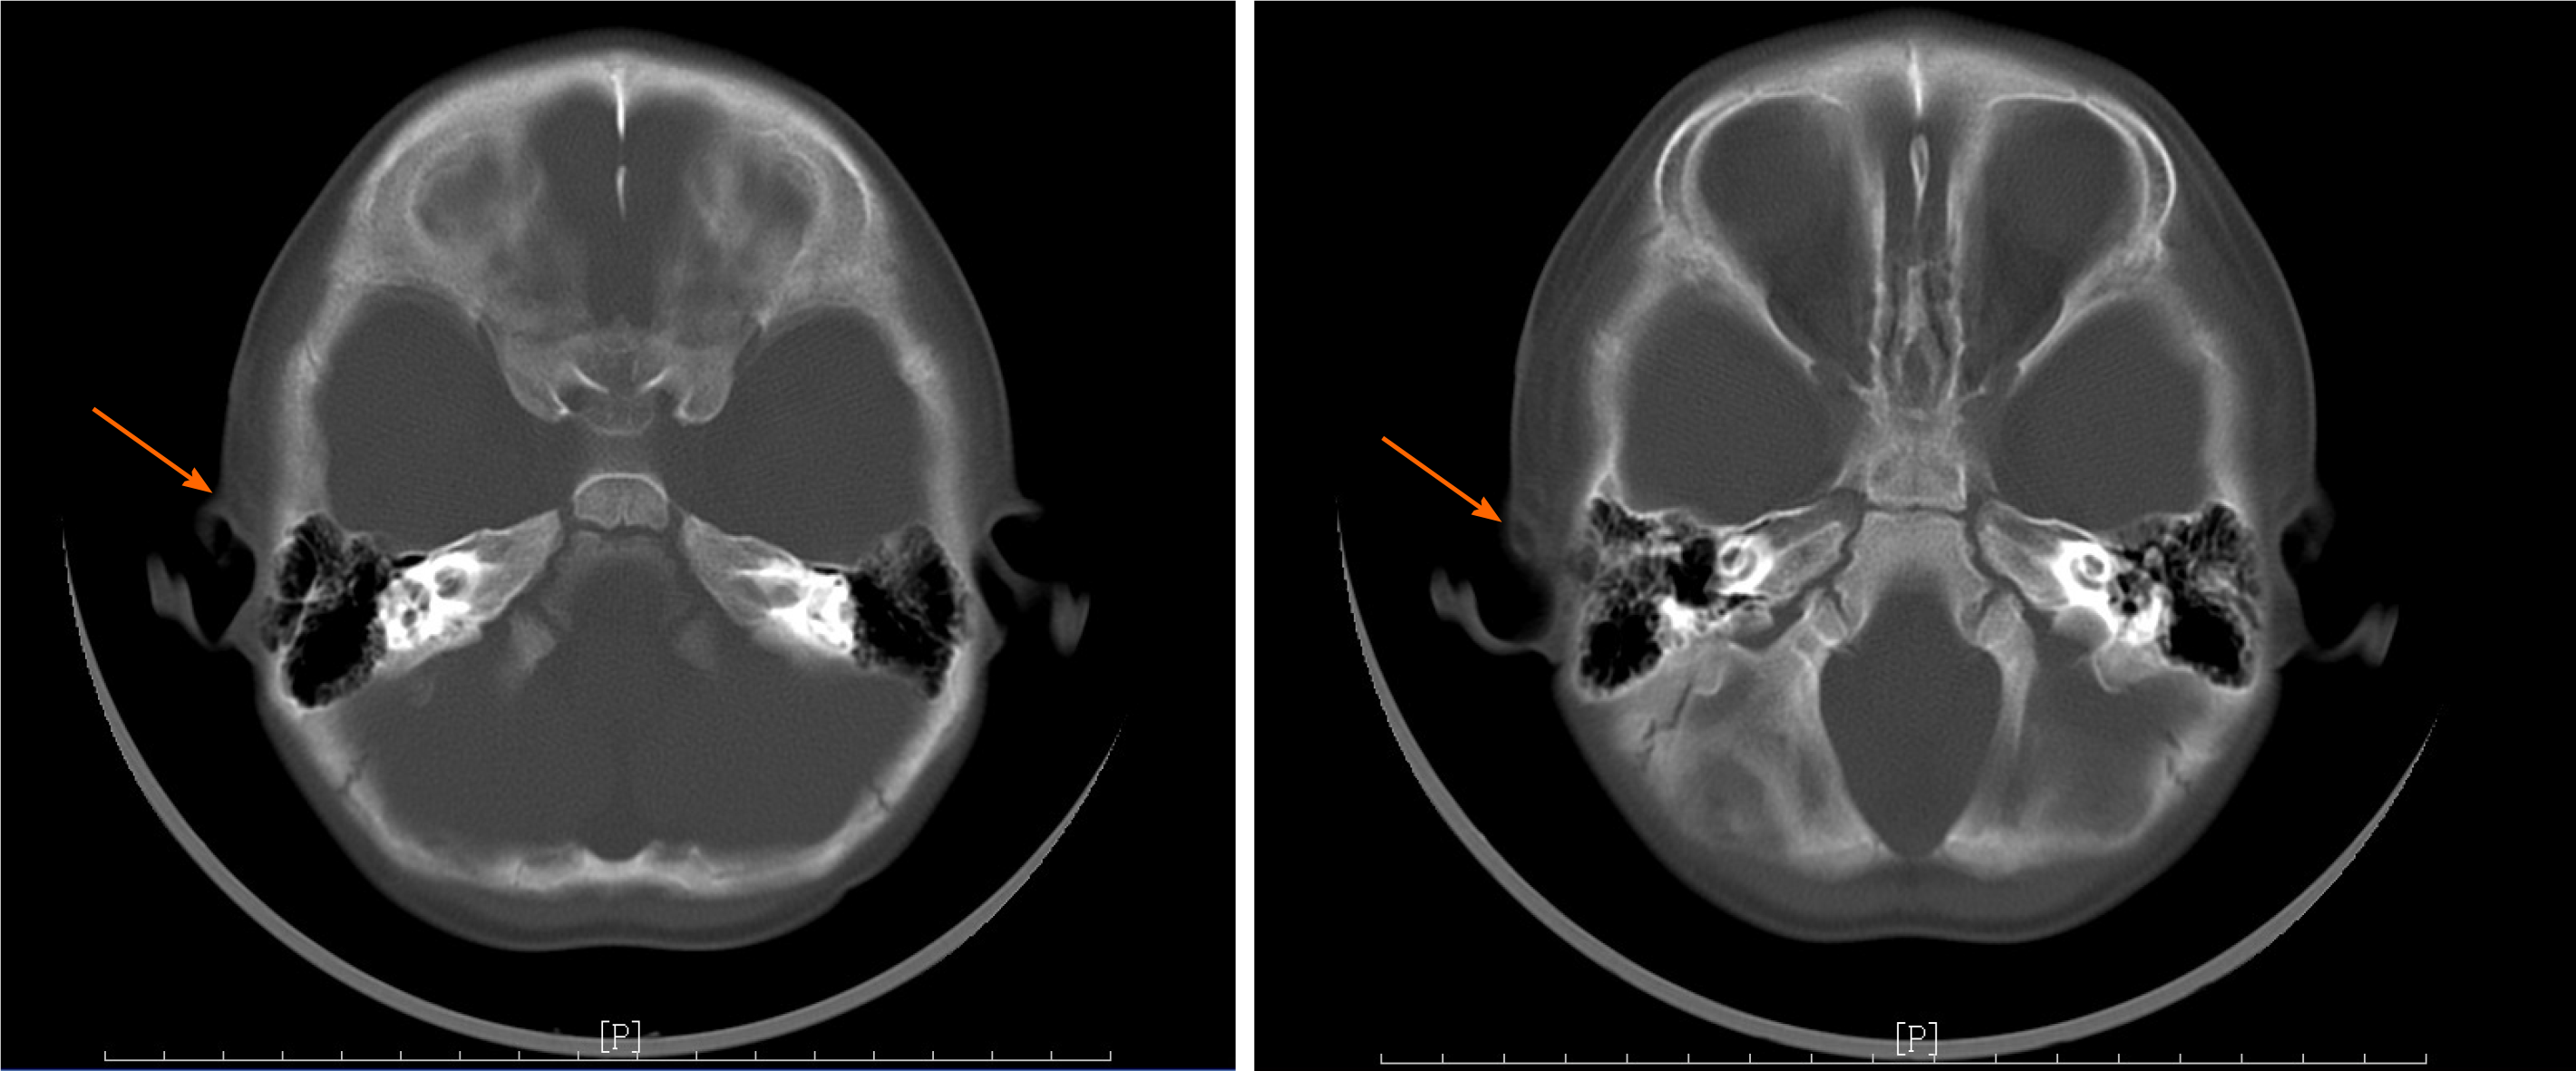
Figure 3 Computed tomography images.
A low-density nodular shadow with a size of 2.2 mm × 7.6 mm × 9.1 mm was observed subcutaneously in the right temporal region. CT value was about 1-17 HU, which was uneven after enhancement. It was about 44-46 HU in the arterial phase and 37-70 HU in the venous phase. Orange arrows indicate the fistula.
- Citation: Gu MZ, Xu HM, Chen F, Xia WW, Li XY. Pediatric temporal fistula: Report of three cases. World J Clin Cases 2021; 9(26): 7811-7817
- URL: https://www.wjgnet.com/2307-8960/full/v9/i26/7811.htm
- DOI: https://dx.doi.org/10.12998/wjcc.v9.i26.7811


