Copyright
©The Author(s) 2021.
World J Clin Cases. Aug 6, 2021; 9(22): 6544-6551
Published online Aug 6, 2021. doi: 10.12998/wjcc.v9.i22.6544
Published online Aug 6, 2021. doi: 10.12998/wjcc.v9.i22.6544
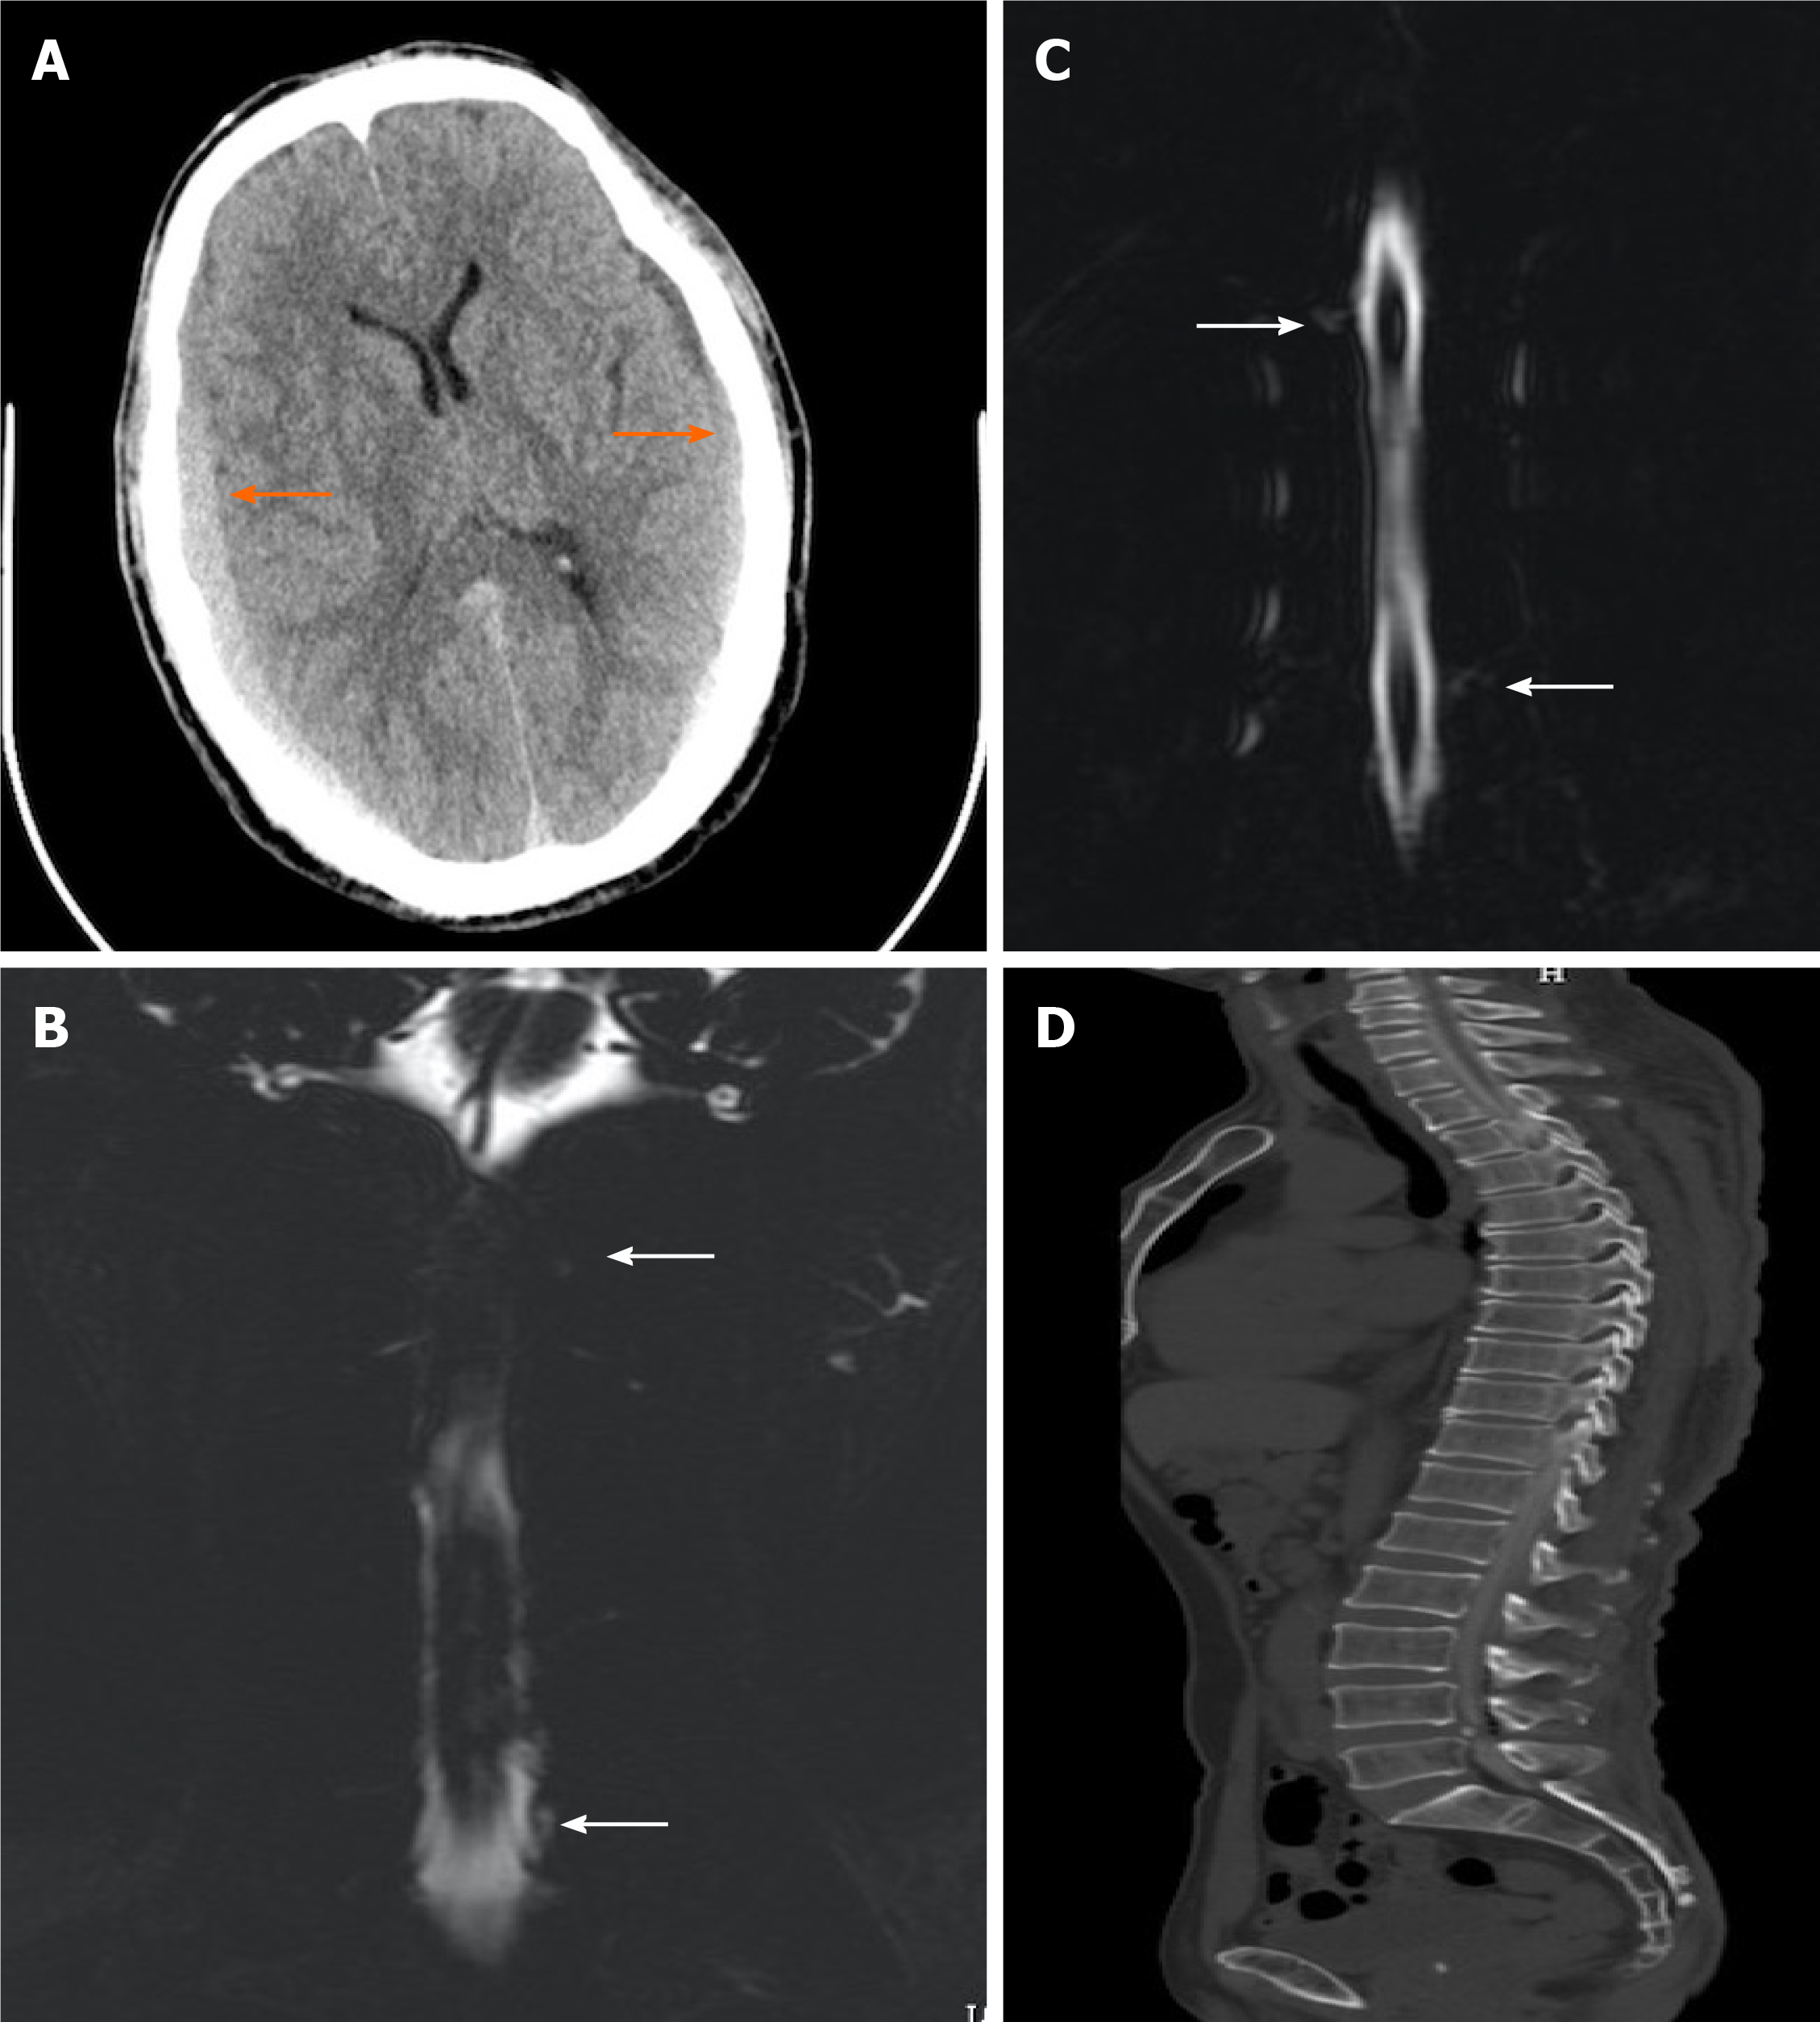
Figure 3 Images of the brain and spine acquired after the epidural blood patch therapy.
A: Axial computed tomography (CT) image shows bilateral subdural hematomas with greater density and volume than the previous hematomas on day 21 after the first epidural blood patch (EBP) therapy (orange arrows); B: Magnetic resonance myelography (MRM) shows multiple sites of cerebrospinal fluid (CSF) leakage at cervicothoracic junctions on day 30 after the second EBP therapy(white arrows); C: MRM shows multiple sites of CSF leakage in the thoracic region on day 30 after the second EBP therapy (white arrows); D: Sagittal CT myelography imaging of the entire spine reveals no obvious CSF leakage on day 57 after the third EBP therapy.
- Citation: Wei TT, Huang H, Chen G, He FF. Management of an intracranial hypotension patient with diplopia as the primary symptom: A case report . World J Clin Cases 2021; 9(22): 6544-6551
- URL: https://www.wjgnet.com/2307-8960/full/v9/i22/6544.htm
- DOI: https://dx.doi.org/10.12998/wjcc.v9.i22.6544


