Copyright
©The Author(s) 2021.
World J Clin Cases. Aug 6, 2021; 9(22): 6522-6530
Published online Aug 6, 2021. doi: 10.12998/wjcc.v9.i22.6522
Published online Aug 6, 2021. doi: 10.12998/wjcc.v9.i22.6522
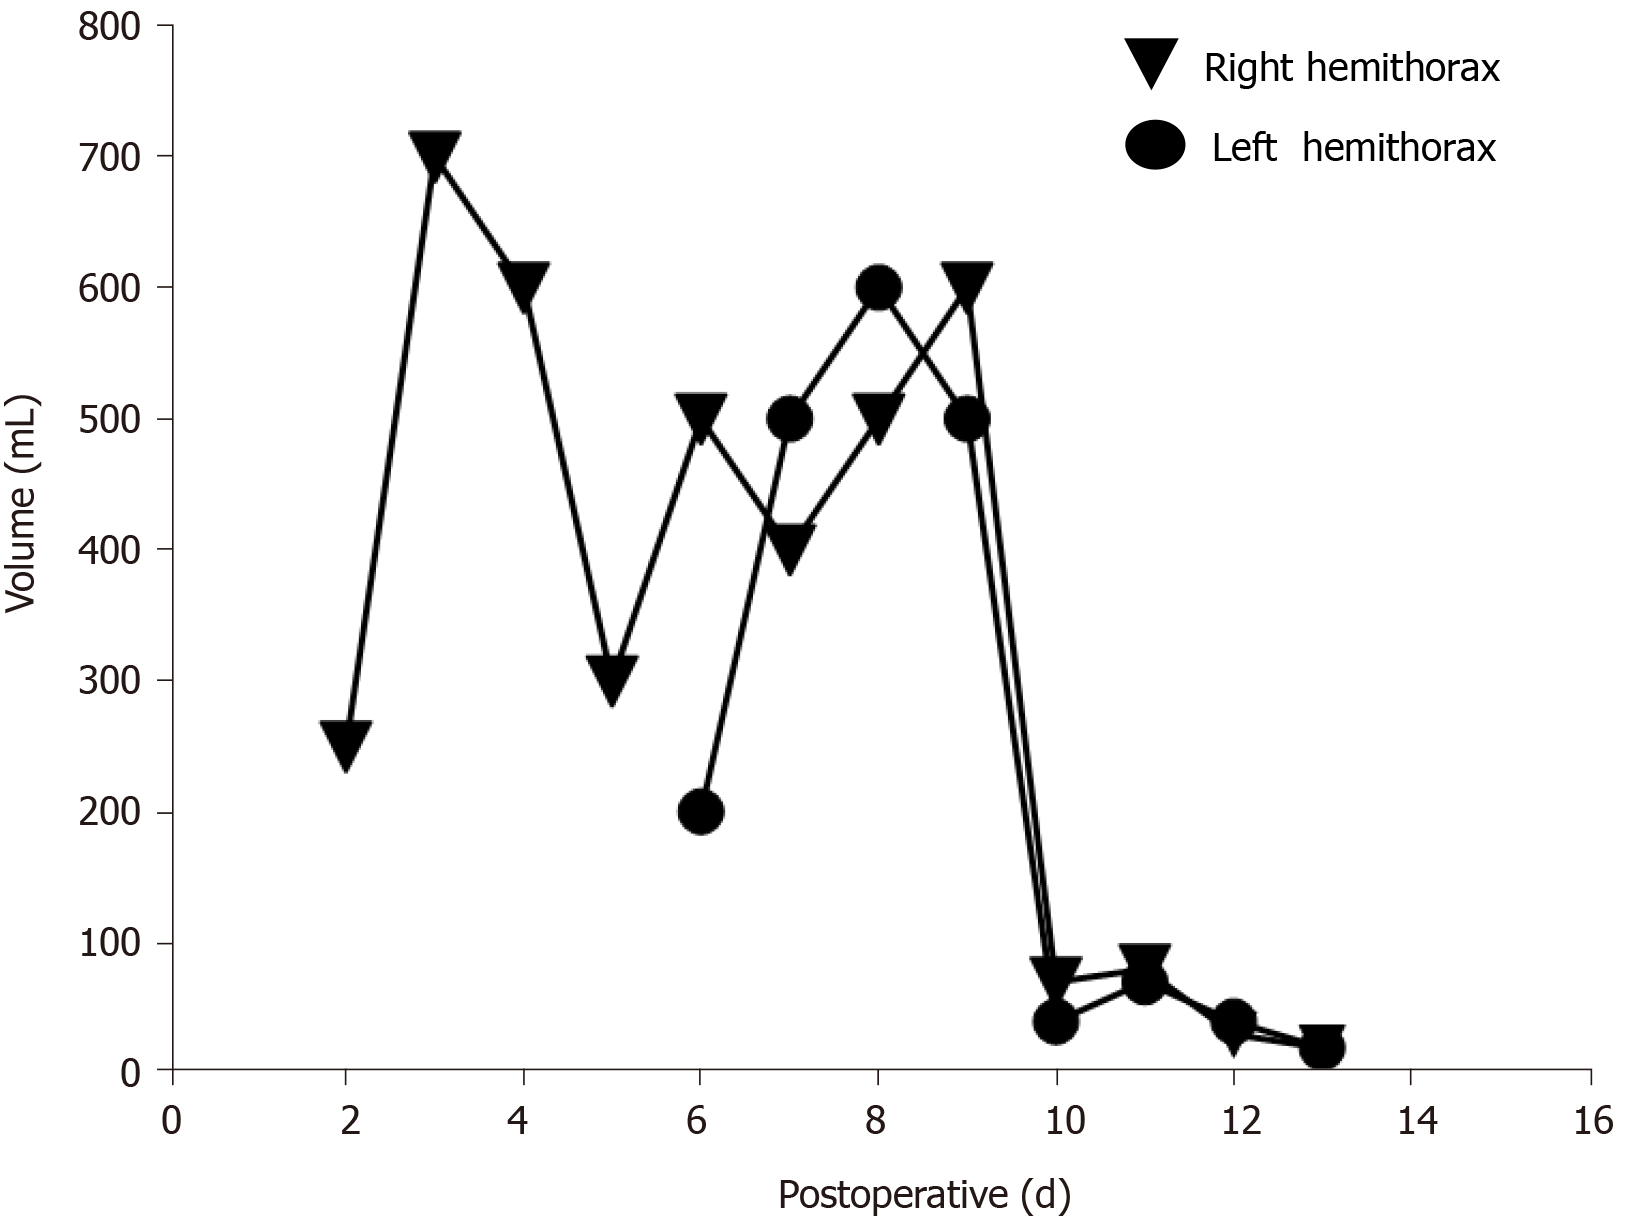
Figure 5 Time-volume line chart.
This chart shows the changes in number of the drainage volume over time. Transverse axis means postoperative day and longitudinal axis means drainage volume. Fasting was administered on day 8, and the volume decreased significantly on day 10. The patient was re-fed on day 11 with no increase of drainage in the next 3 consecutive days.
- Citation: Huang XM, Luo M, Ran LY, You XH, Wu DW, Huang SS, Gong Q. Chylothorax following posterior low lumbar fusion surgery: A case report. World J Clin Cases 2021; 9(22): 6522-6530
- URL: https://www.wjgnet.com/2307-8960/full/v9/i22/6522.htm
- DOI: https://dx.doi.org/10.12998/wjcc.v9.i22.6522


