Copyright
©The Author(s) 2021.
World J Clin Cases. Jul 26, 2021; 9(21): 5889-5899
Published online Jul 26, 2021. doi: 10.12998/wjcc.v9.i21.5889
Published online Jul 26, 2021. doi: 10.12998/wjcc.v9.i21.5889
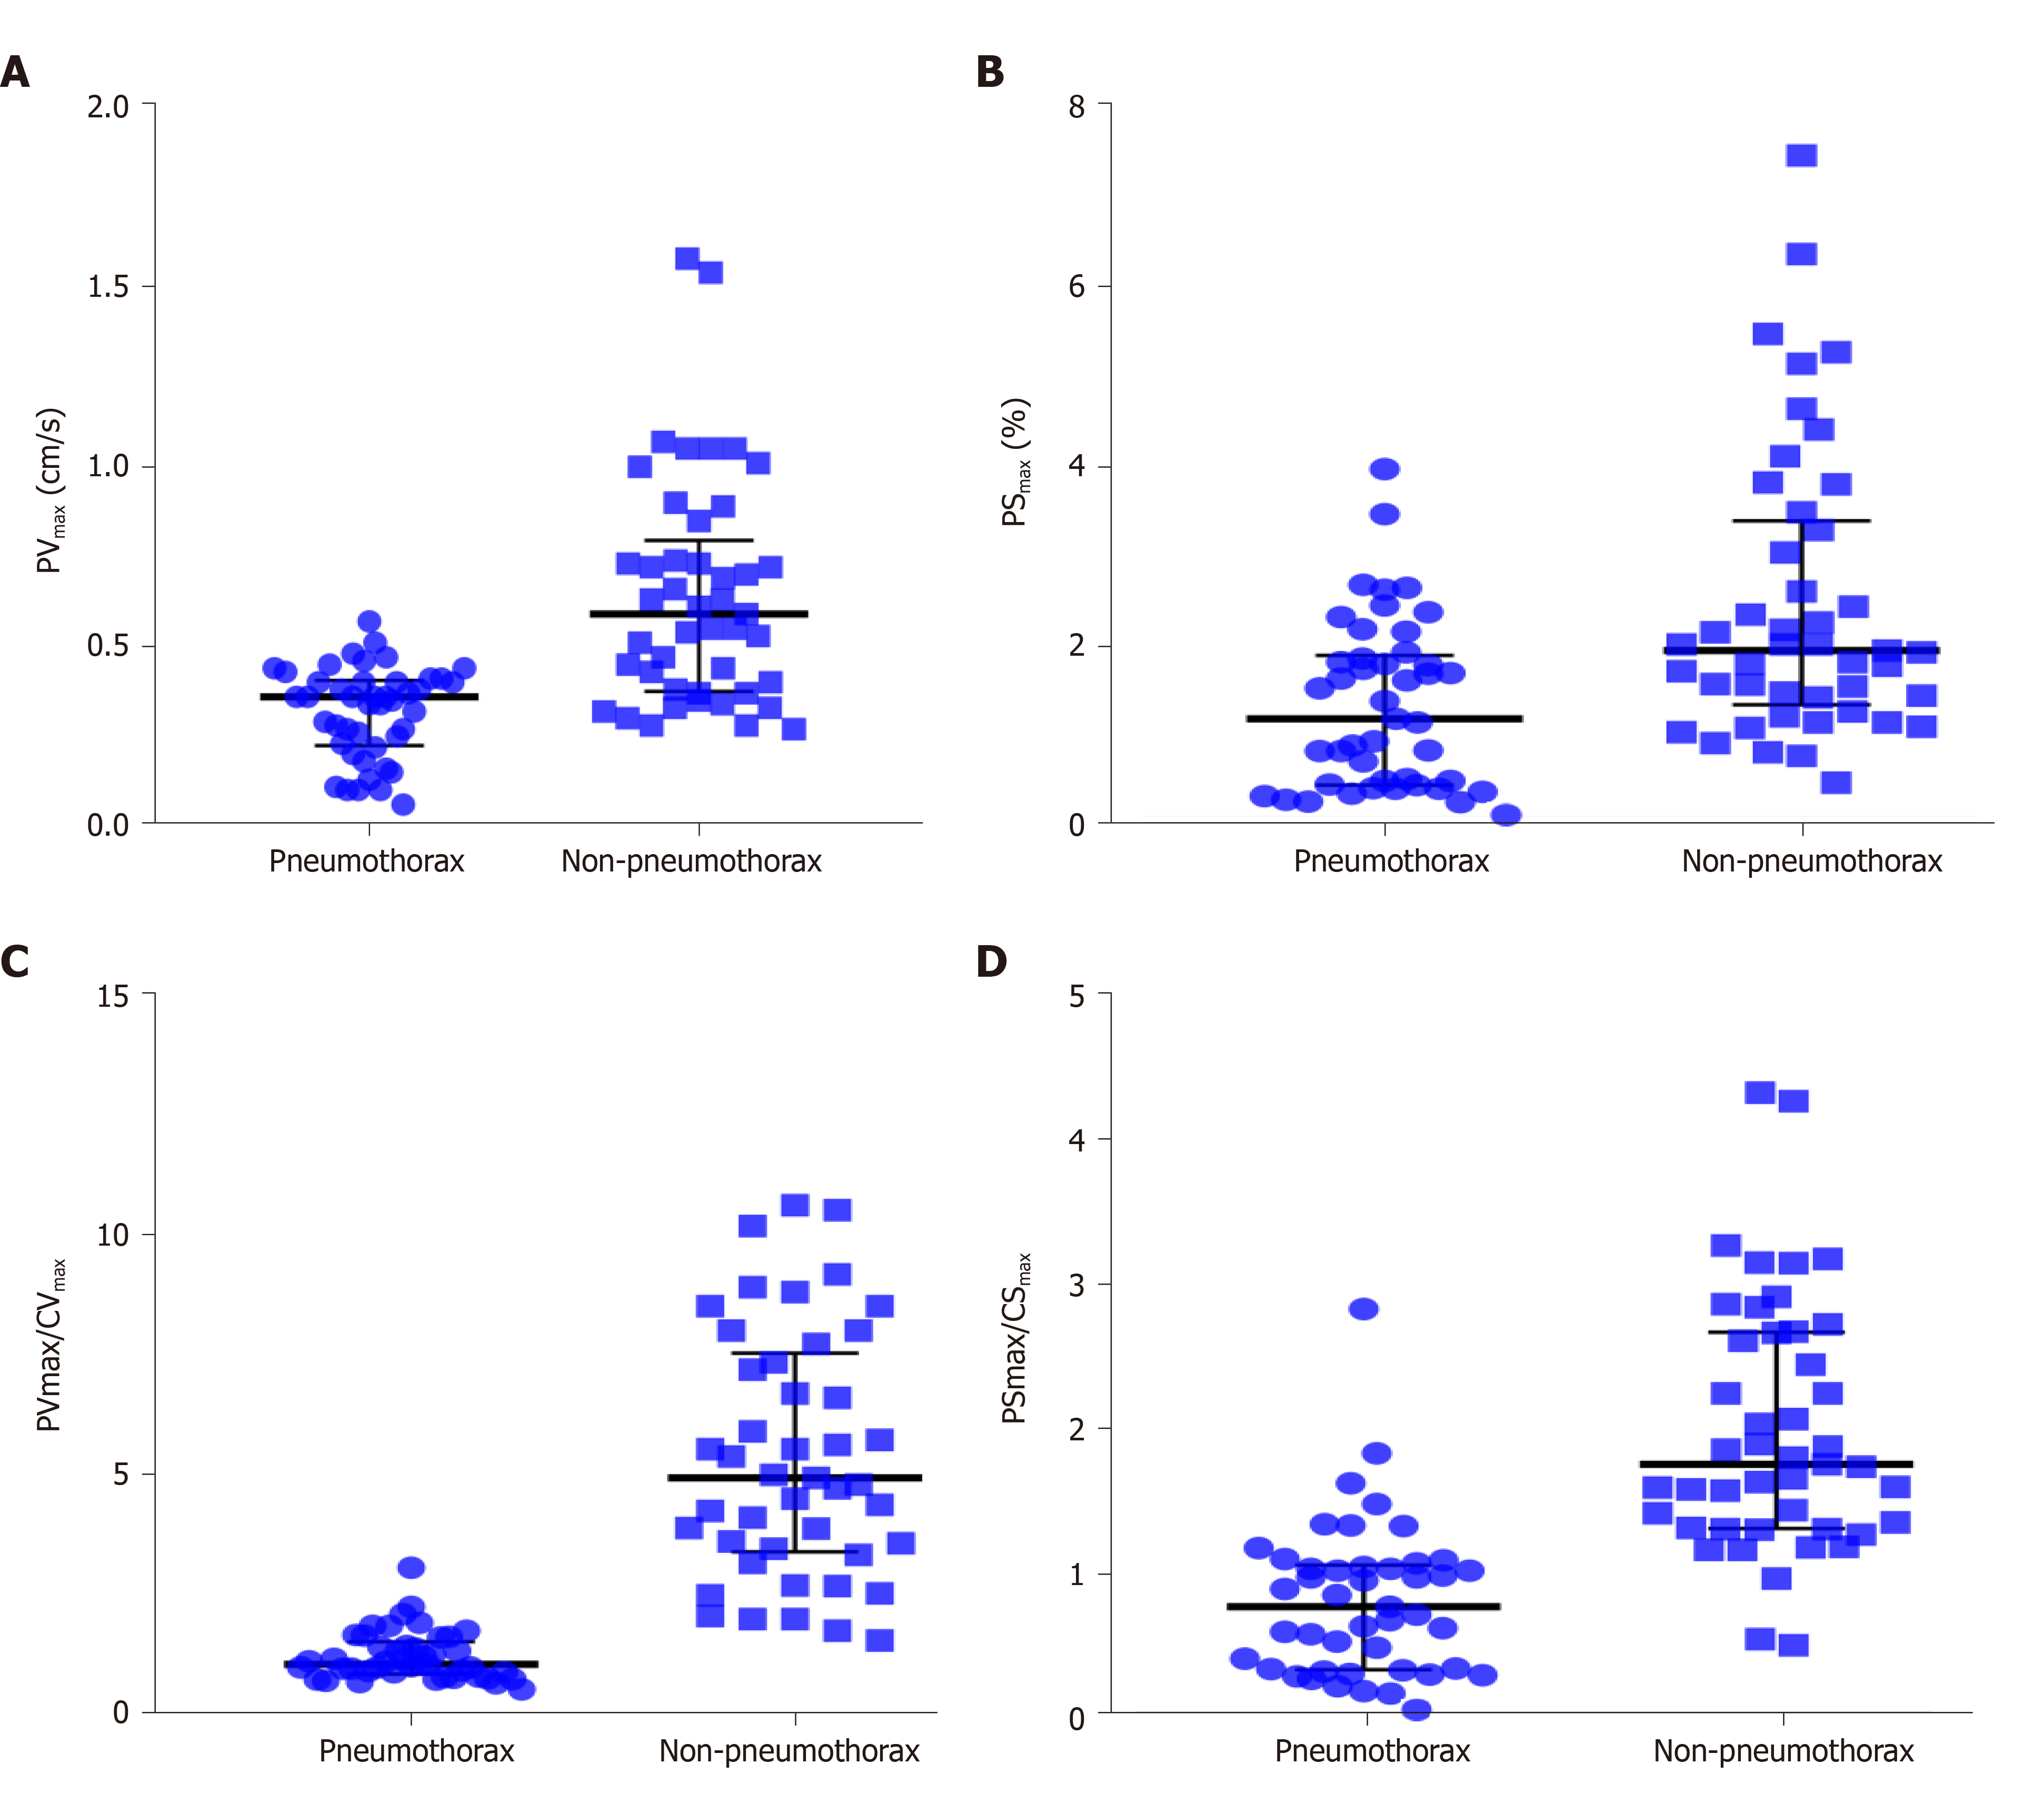
Figure 5 Scatter plot of measurements obtained by tissue Doppler imaging.
A: Scatter plot of peak pleural line velocity; B: Scatter plot of peak pleural line strain value; C: Scatter plot of peak pleural line velocity/peak chest wall tissue velocity; D: Scatter plot of peak pleural line strain value/peak chest wall tissue strain value. Data are expressed as the median and interquartile range. PVmax: Peak pleural line velocity; CVmax: Peak chest wall tissue velocity; PSmax: Peak pleural line strain value; CSmax: Peak chest wall tissue strain value.
- Citation: Xiao R, Shao Q, Zhao N, Liu F, Qian KJ. Quantification analysis of pleural line movement for the diagnosis of pneumothorax. World J Clin Cases 2021; 9(21): 5889-5899
- URL: https://www.wjgnet.com/2307-8960/full/v9/i21/5889.htm
- DOI: https://dx.doi.org/10.12998/wjcc.v9.i21.5889


