Copyright
©The Author(s) 2021.
World J Clin Cases. Jul 26, 2021; 9(21): 5889-5899
Published online Jul 26, 2021. doi: 10.12998/wjcc.v9.i21.5889
Published online Jul 26, 2021. doi: 10.12998/wjcc.v9.i21.5889
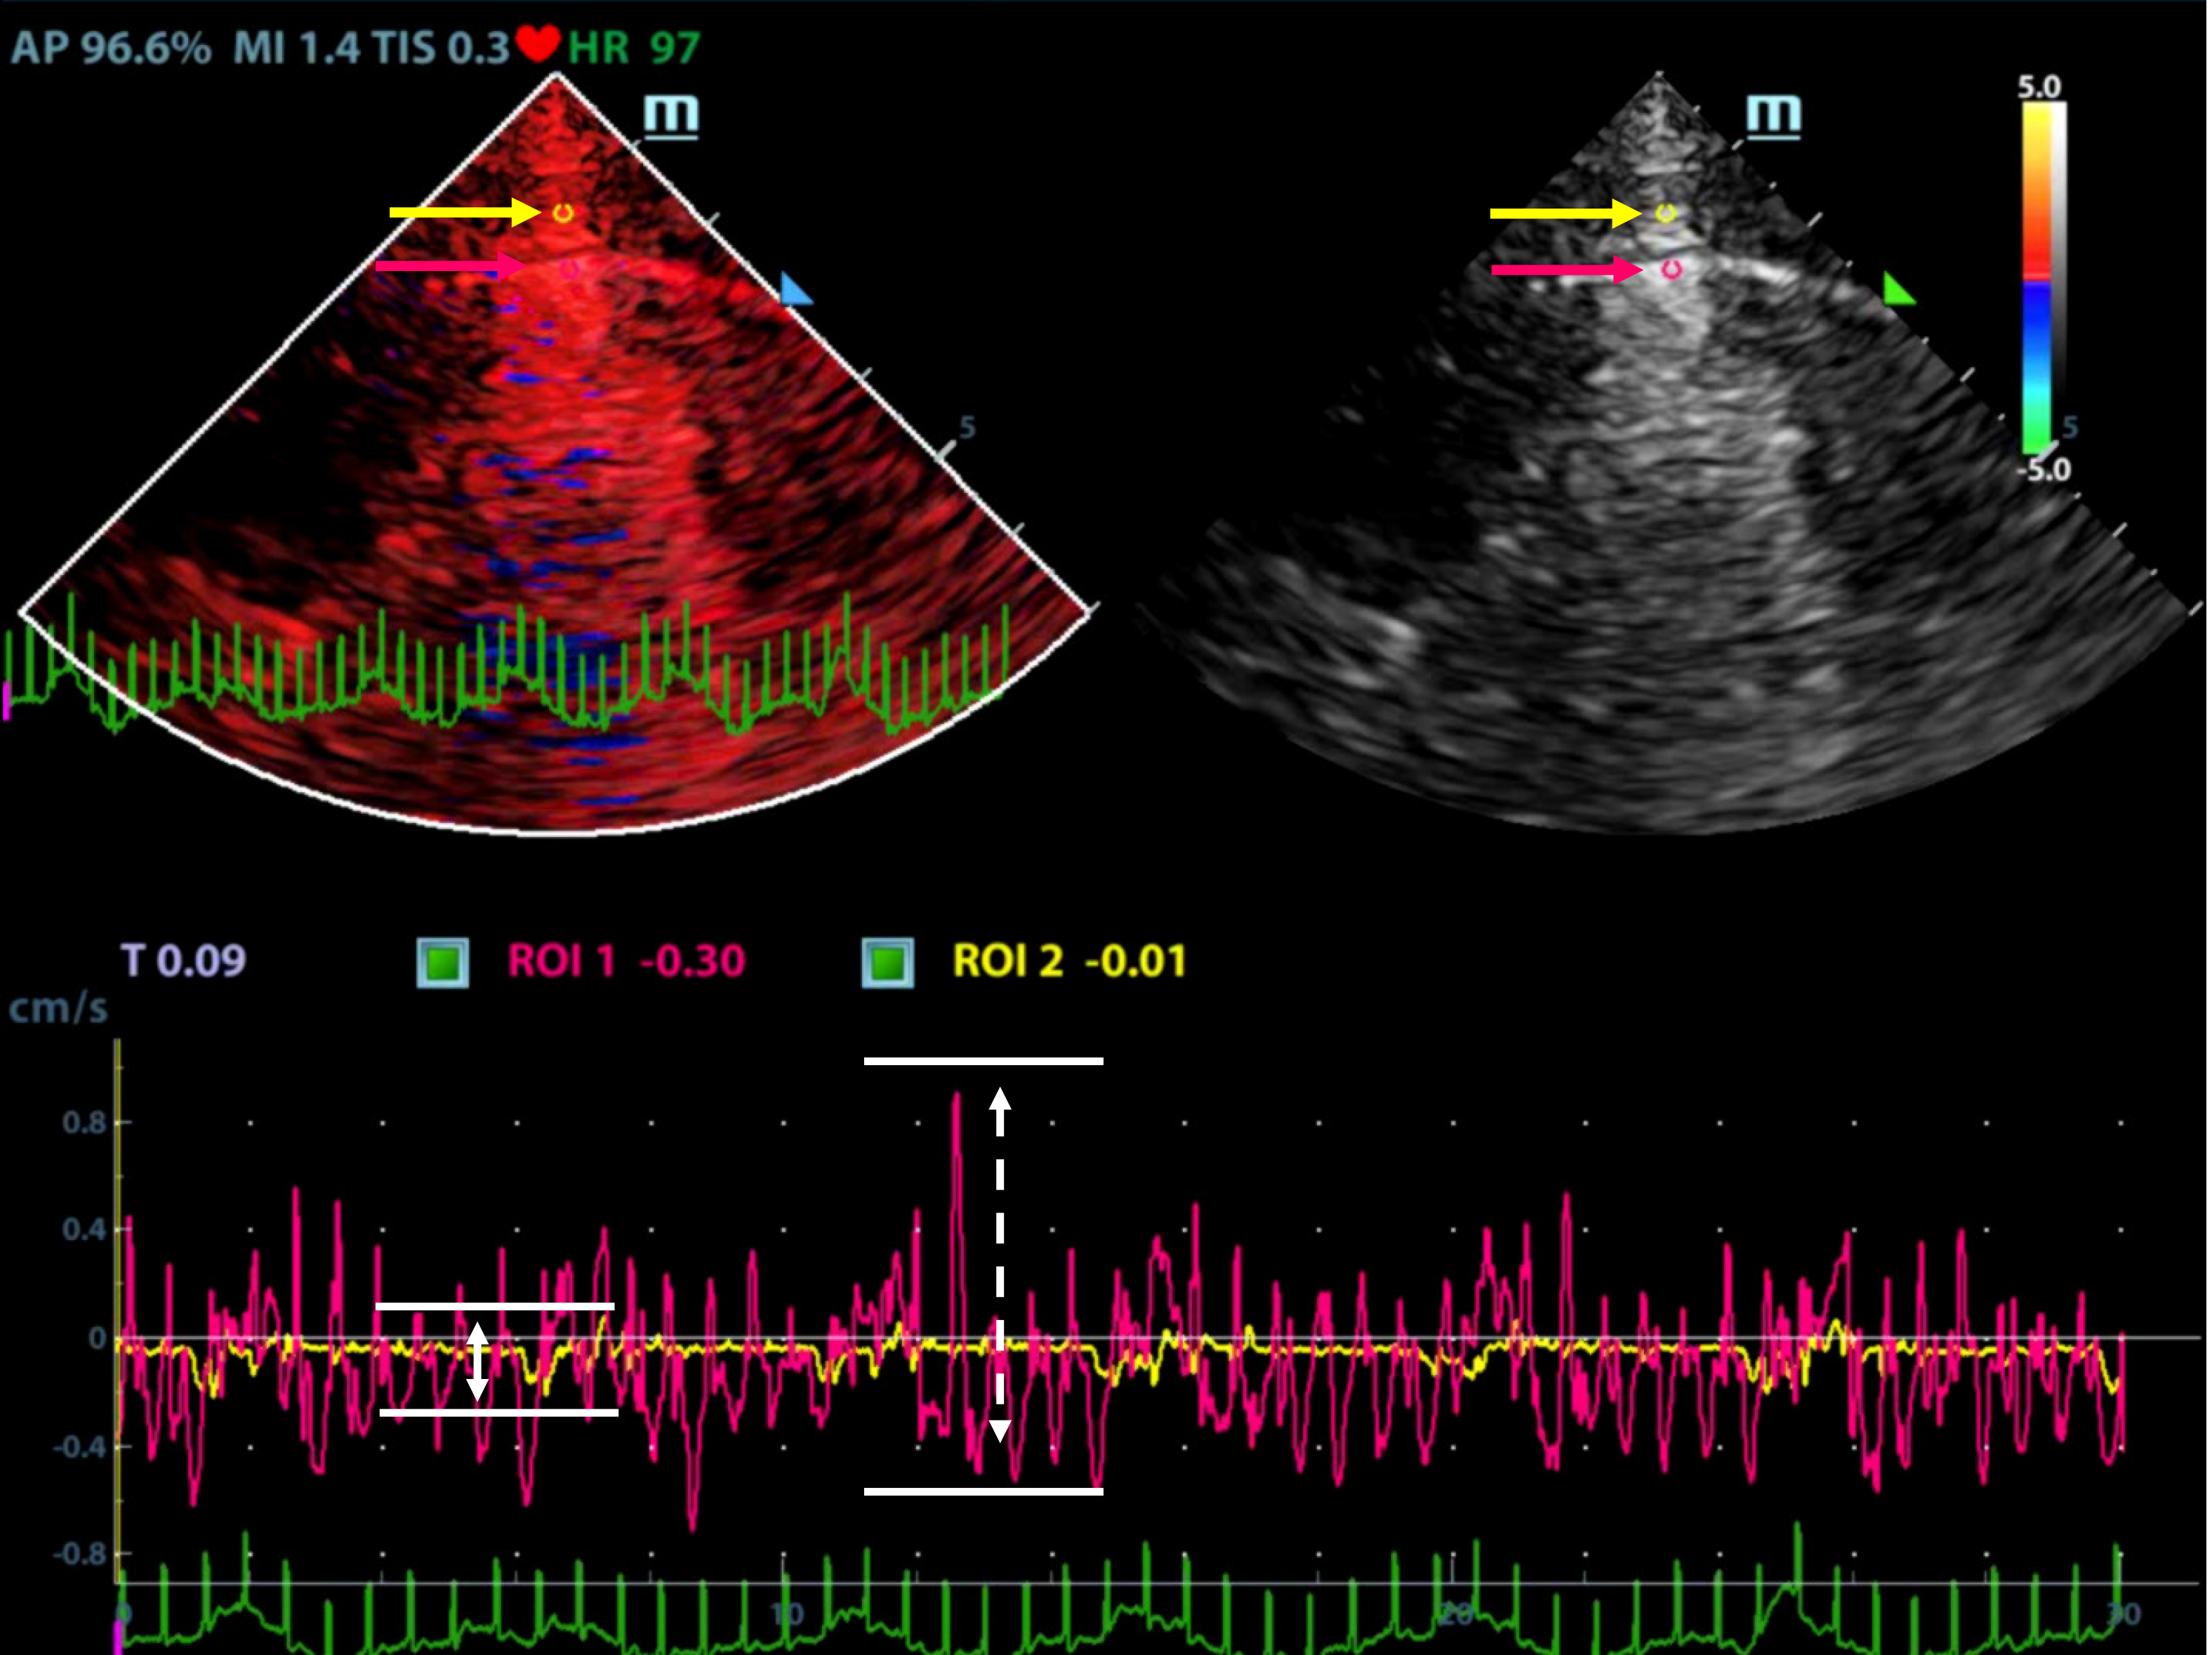
Figure 1 Peak velocity measurement.
Tissue Doppler image (left), ultrasound image (right); region of interest 1 (ROI1, red dot) at the midpoint of the pleural line, ROI2 (yellow dot), 0.5 cm from the pleural line; velocity-time curve of ROI1 (red curve), velocity-time curve of ROI2 (yellow curve); velocity of ROI1 (white arrow, dotted line), peak velocity of ROI2 (white arrow, solid line).
- Citation: Xiao R, Shao Q, Zhao N, Liu F, Qian KJ. Quantification analysis of pleural line movement for the diagnosis of pneumothorax. World J Clin Cases 2021; 9(21): 5889-5899
- URL: https://www.wjgnet.com/2307-8960/full/v9/i21/5889.htm
- DOI: https://dx.doi.org/10.12998/wjcc.v9.i21.5889


