Copyright
©The Author(s) 2021.
World J Clin Cases. Jul 16, 2021; 9(20): 5737-5743
Published online Jul 16, 2021. doi: 10.12998/wjcc.v9.i20.5737
Published online Jul 16, 2021. doi: 10.12998/wjcc.v9.i20.5737
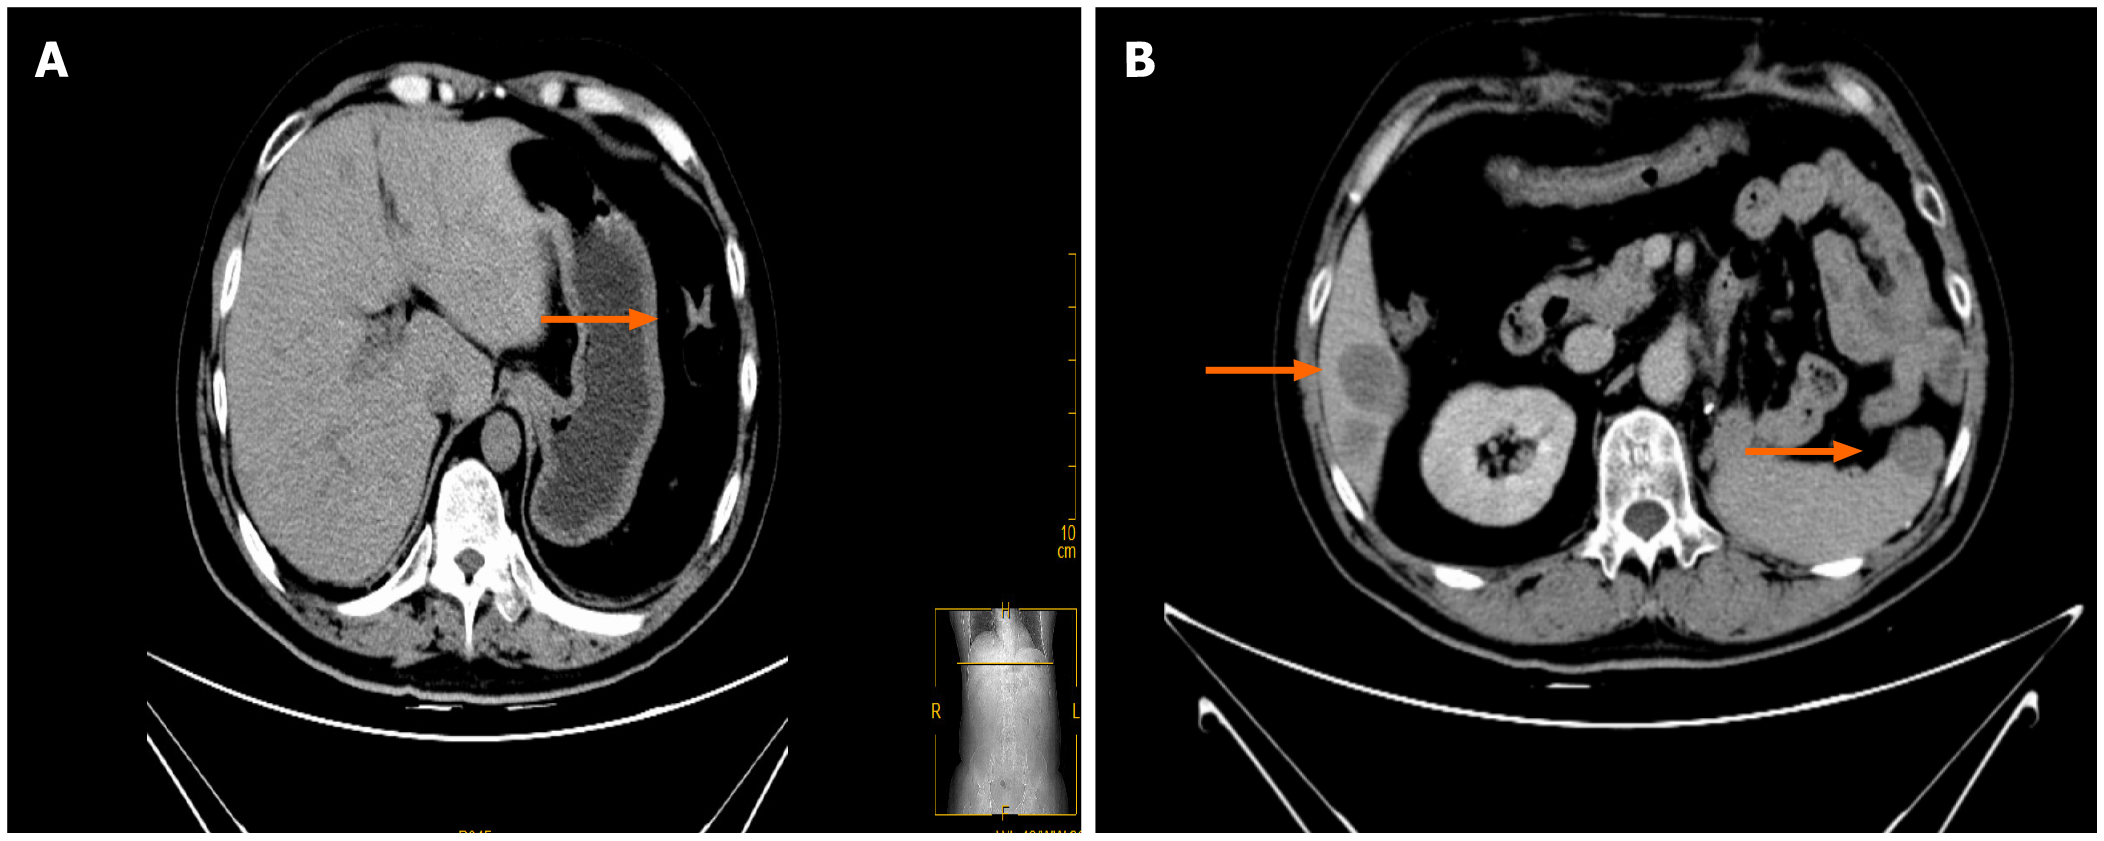
Figure 4 Multiple retroperitoneal lymph node metastases increased (the arrow on the left indicates hepatic metastases, the arrow on the right indicates spleen metastases).
A: After the peritoneum was visible in the operative area, a nodular soft tissue density shadow with a size of approximately 15 mm × 19 mm could be seen. Multiple patchy slightly low-density shadows could be seen scattered in the liver parenchyma with fuzzy boundaries (the arrow indicates a nodular soft tissue density shadow in the retroperitoneal area); B: Local recurrence and invasion of the spleen were observed, with near-elliptical low-density foci of approximately 17 mm × 24 mm in the leading edge of the spleen. The number of multiple metastases in the liver increased.
- Citation: Zhou Z, Luo HM, Tang J, Xu WJ, Wang BH, Peng XH, Tan H, Liu L, Long XY, Hong YD, Wu XB, Wang JP, Wang BQ, Xie HH, Fang Y, Luo Y, Li R, Wang Y. Multidisciplinary team therapy for left giant adrenocortical carcinoma: A case report. World J Clin Cases 2021; 9(20): 5737-5743
- URL: https://www.wjgnet.com/2307-8960/full/v9/i20/5737.htm
- DOI: https://dx.doi.org/10.12998/wjcc.v9.i20.5737


