Copyright
©The Author(s) 2021.
World J Clin Cases. Jul 16, 2021; 9(20): 5526-5534
Published online Jul 16, 2021. doi: 10.12998/wjcc.v9.i20.5526
Published online Jul 16, 2021. doi: 10.12998/wjcc.v9.i20.5526
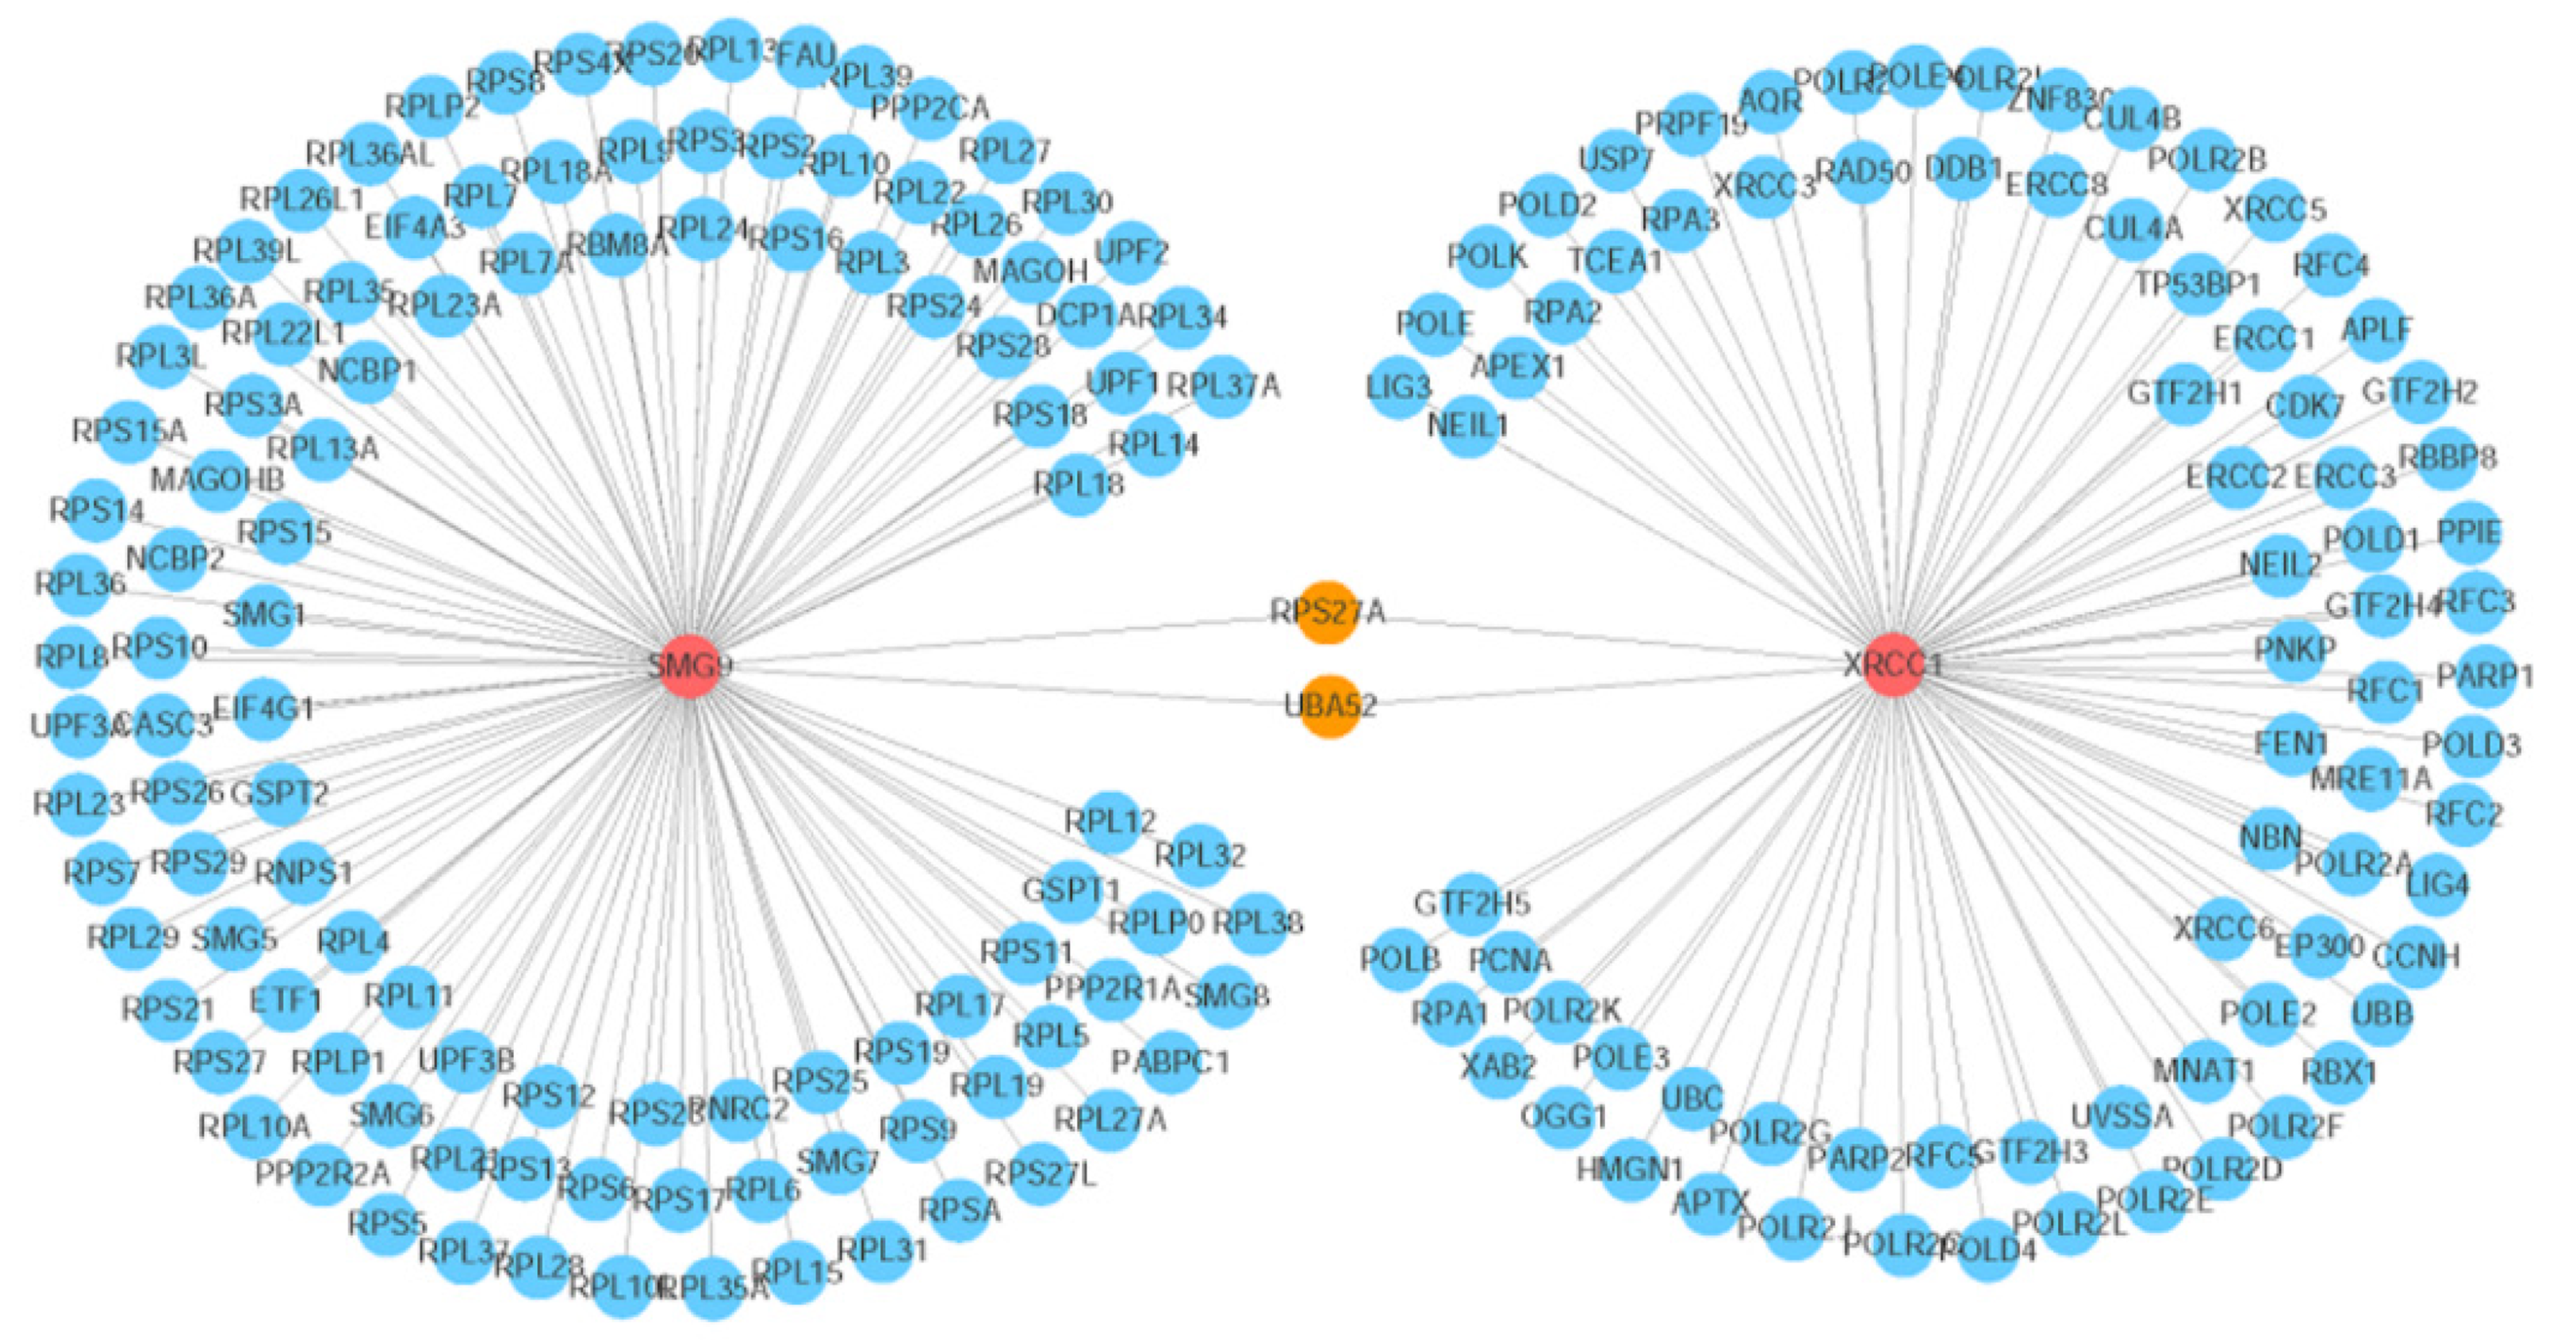
Figure 6 Visualization of the gene network that interacts with the SMG9 and XRCC1 genes.
The red circles indicate the query genes (SMG9 and XRCC1), the orange circles represent the genes that interact with both of the two query genes, and the blue circles denote the other interacting genes. The line thickness indicates the strength of the interaction (interaction score).
- Citation: Feng YL, Li ND. Duplication of 19q (13.2-13.31) associated with comitant esotropia: A case report. World J Clin Cases 2021; 9(20): 5526-5534
- URL: https://www.wjgnet.com/2307-8960/full/v9/i20/5526.htm
- DOI: https://dx.doi.org/10.12998/wjcc.v9.i20.5526


