Copyright
©The Author(s) 2021.
World J Clin Cases. Jul 16, 2021; 9(20): 5526-5534
Published online Jul 16, 2021. doi: 10.12998/wjcc.v9.i20.5526
Published online Jul 16, 2021. doi: 10.12998/wjcc.v9.i20.5526
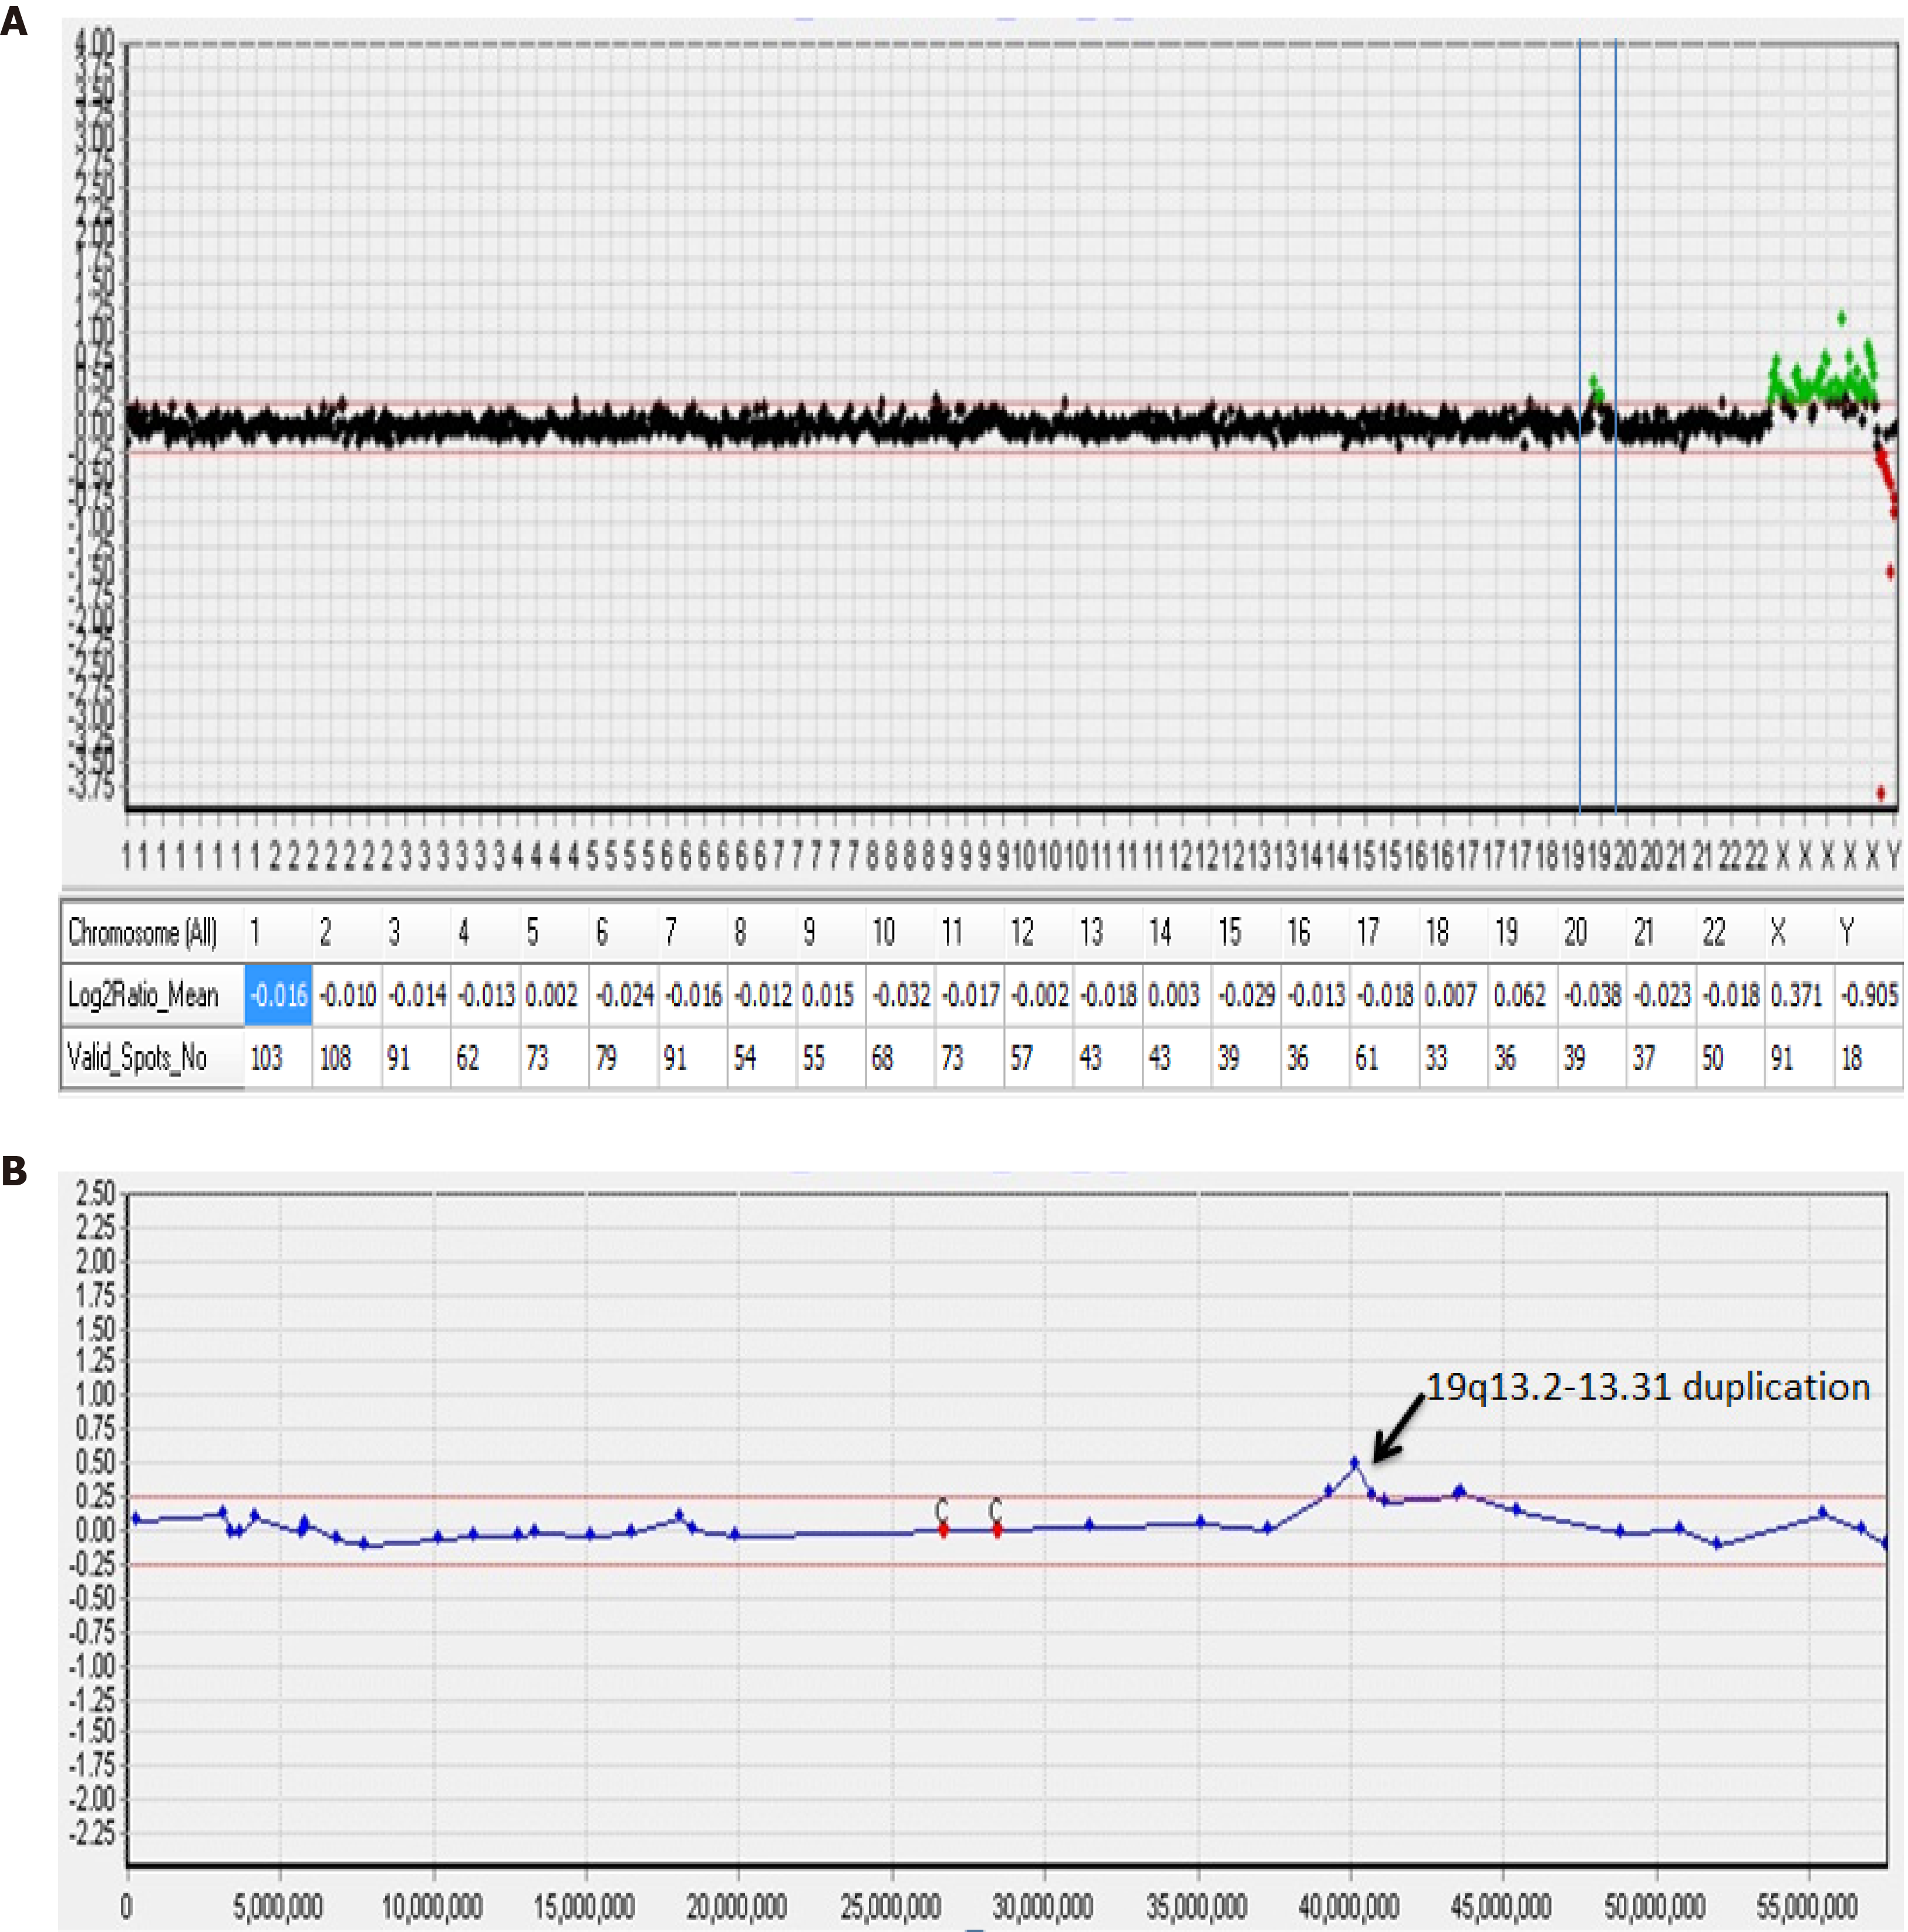
Figure 3 Array comparative genomic hybridization analysis performed suggests a mosaic gain of 19q.
A: Array comparative genomic hybridization (aCGH) data profile in whole chromosomes. A dot represents a bacterial artificial chromosome clone, the X-axis represents the chromosome number (1-22, X,Y), and the Y-axis represents the log2 T/R signal ratio value. The table below the graph represents the average log2 T/R signal ratio value for each chromosome. Green dots represent a copy number gain (log2 T/R signal ratio value > 0.25) and duplication on chromosome 19; B: aCGH profile from chromosome 19 shows a duplication on the long arm. The size of the duplication fragment was estimated to be 4.42 Mb (chr19:39,343,725-43,762,586).
- Citation: Feng YL, Li ND. Duplication of 19q (13.2-13.31) associated with comitant esotropia: A case report. World J Clin Cases 2021; 9(20): 5526-5534
- URL: https://www.wjgnet.com/2307-8960/full/v9/i20/5526.htm
- DOI: https://dx.doi.org/10.12998/wjcc.v9.i20.5526


