Copyright
©The Author(s) 2021.
World J Clin Cases. Jul 6, 2021; 9(19): 5345-5351
Published online Jul 6, 2021. doi: 10.12998/wjcc.v9.i19.5345
Published online Jul 6, 2021. doi: 10.12998/wjcc.v9.i19.5345
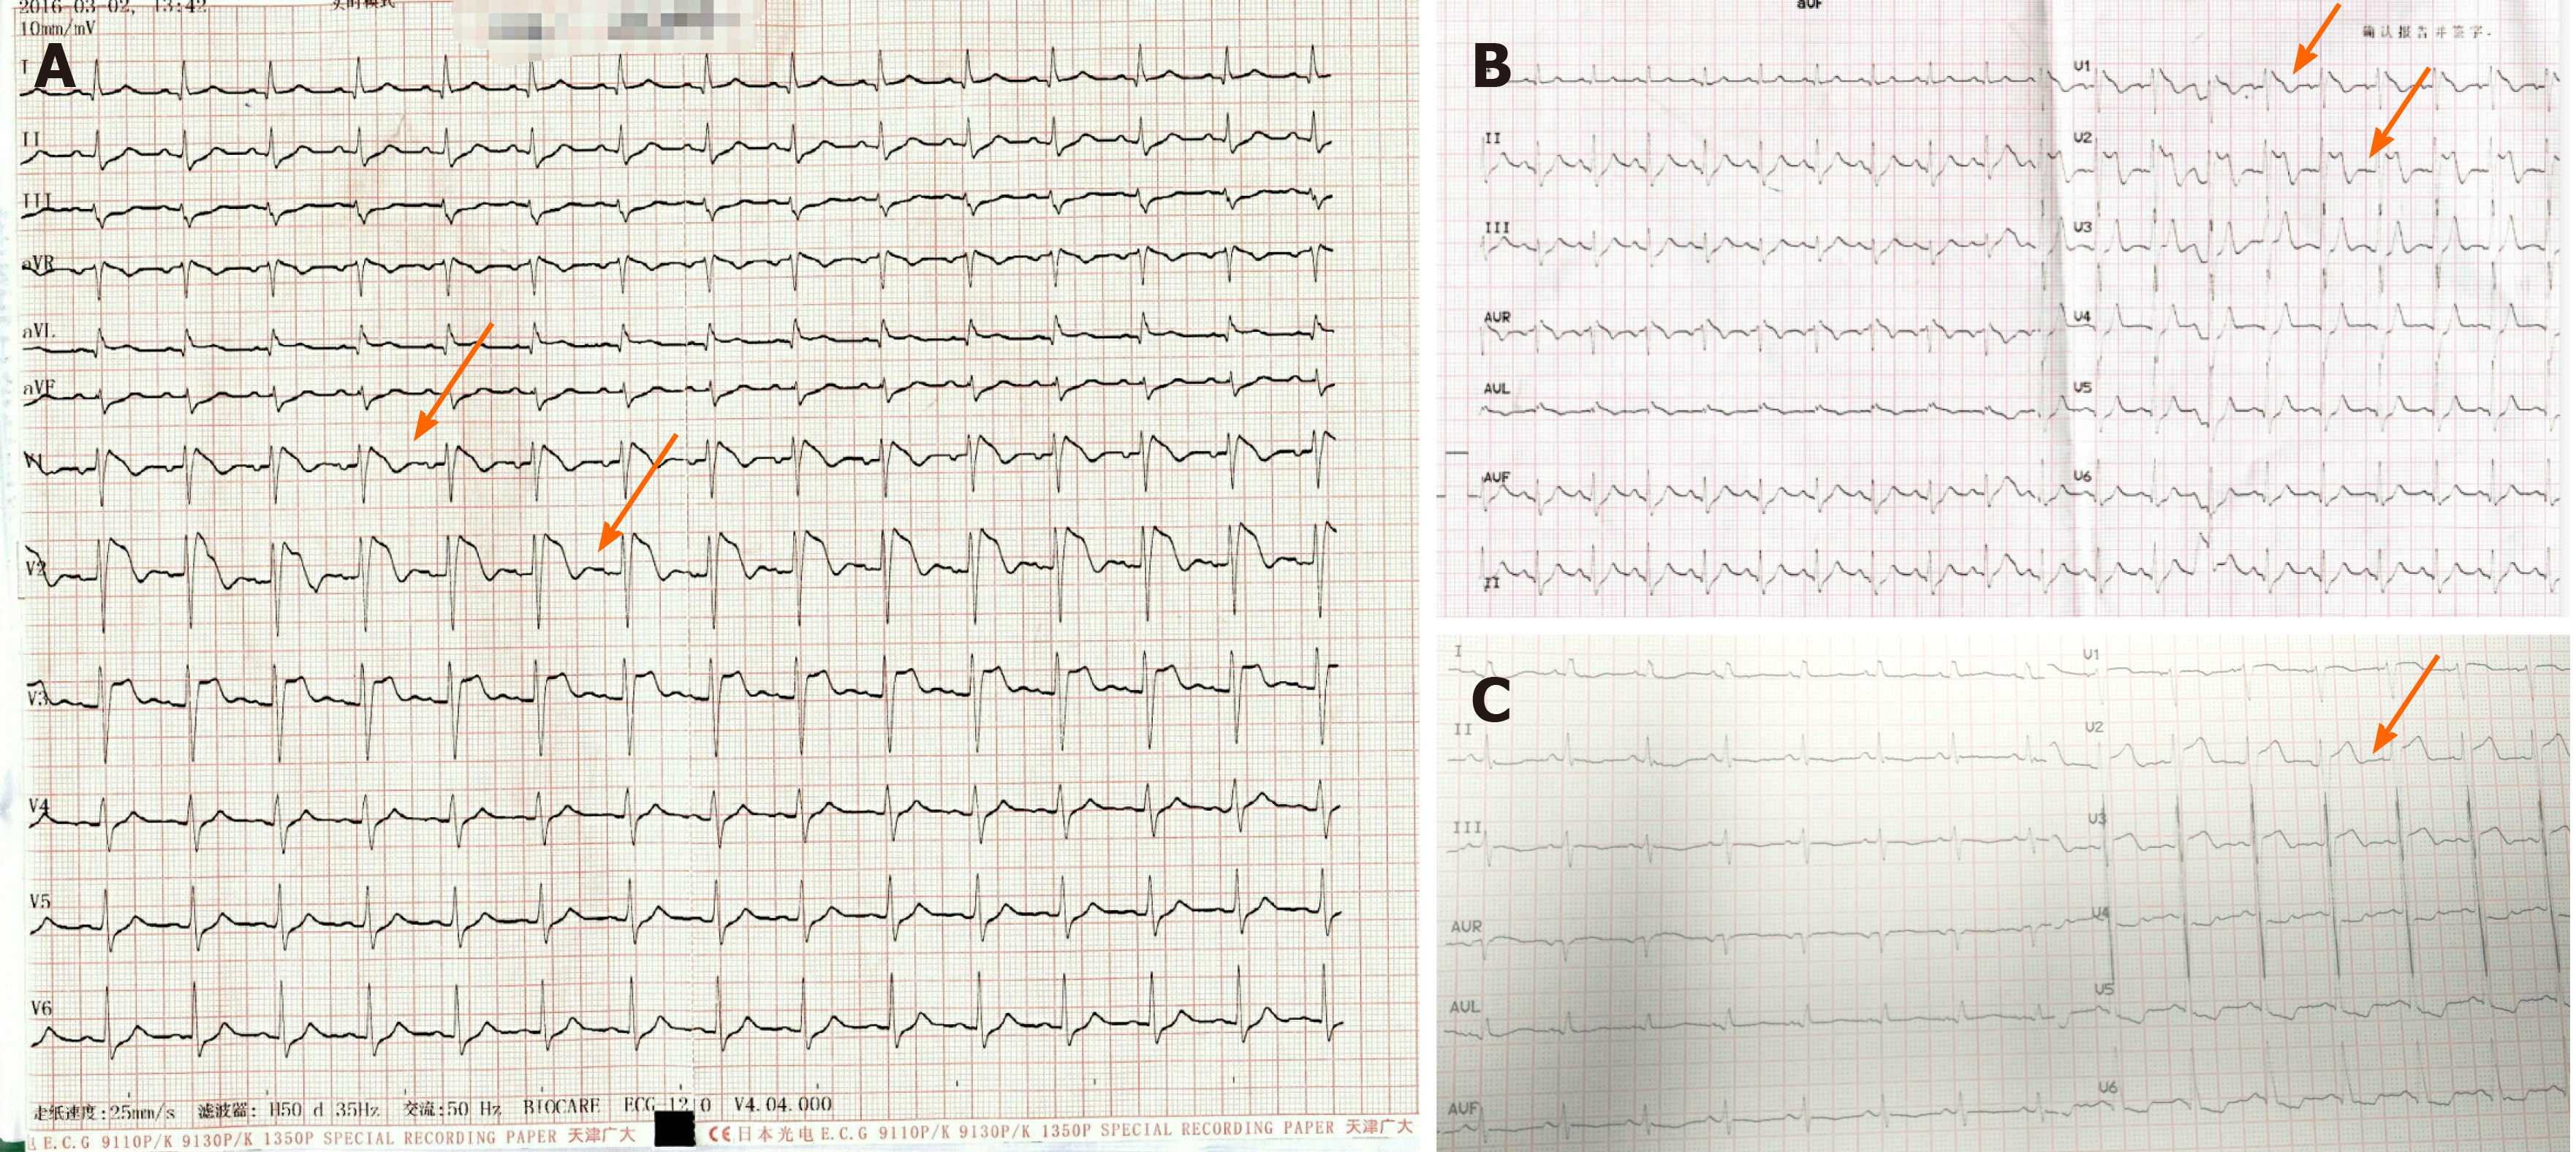
Figure 1 12-lead electrocardiogram of the patient.
A and B: A typical type 1 Brugada electrocardiogram (ECG) pattern, with coved-type ST-segment elevations of > 2 mm in V1 to V2 followed by a negative T-wave in two of the right precordial leads. C: ECG recording in the ward showing the elevation of V2-V3.
- Citation: Ni GH, Jiang H, Men L, Wei YY, A D, Ma X. Brugada syndrome associated with out-of-hospital cardiac arrest: A case report. World J Clin Cases 2021; 9(19): 5345-5351
- URL: https://www.wjgnet.com/2307-8960/full/v9/i19/5345.htm
- DOI: https://dx.doi.org/10.12998/wjcc.v9.i19.5345


