Copyright
©The Author(s) 2021.
World J Clin Cases. Jun 26, 2021; 9(18): 4520-4541
Published online Jun 26, 2021. doi: 10.12998/wjcc.v9.i18.4520
Published online Jun 26, 2021. doi: 10.12998/wjcc.v9.i18.4520
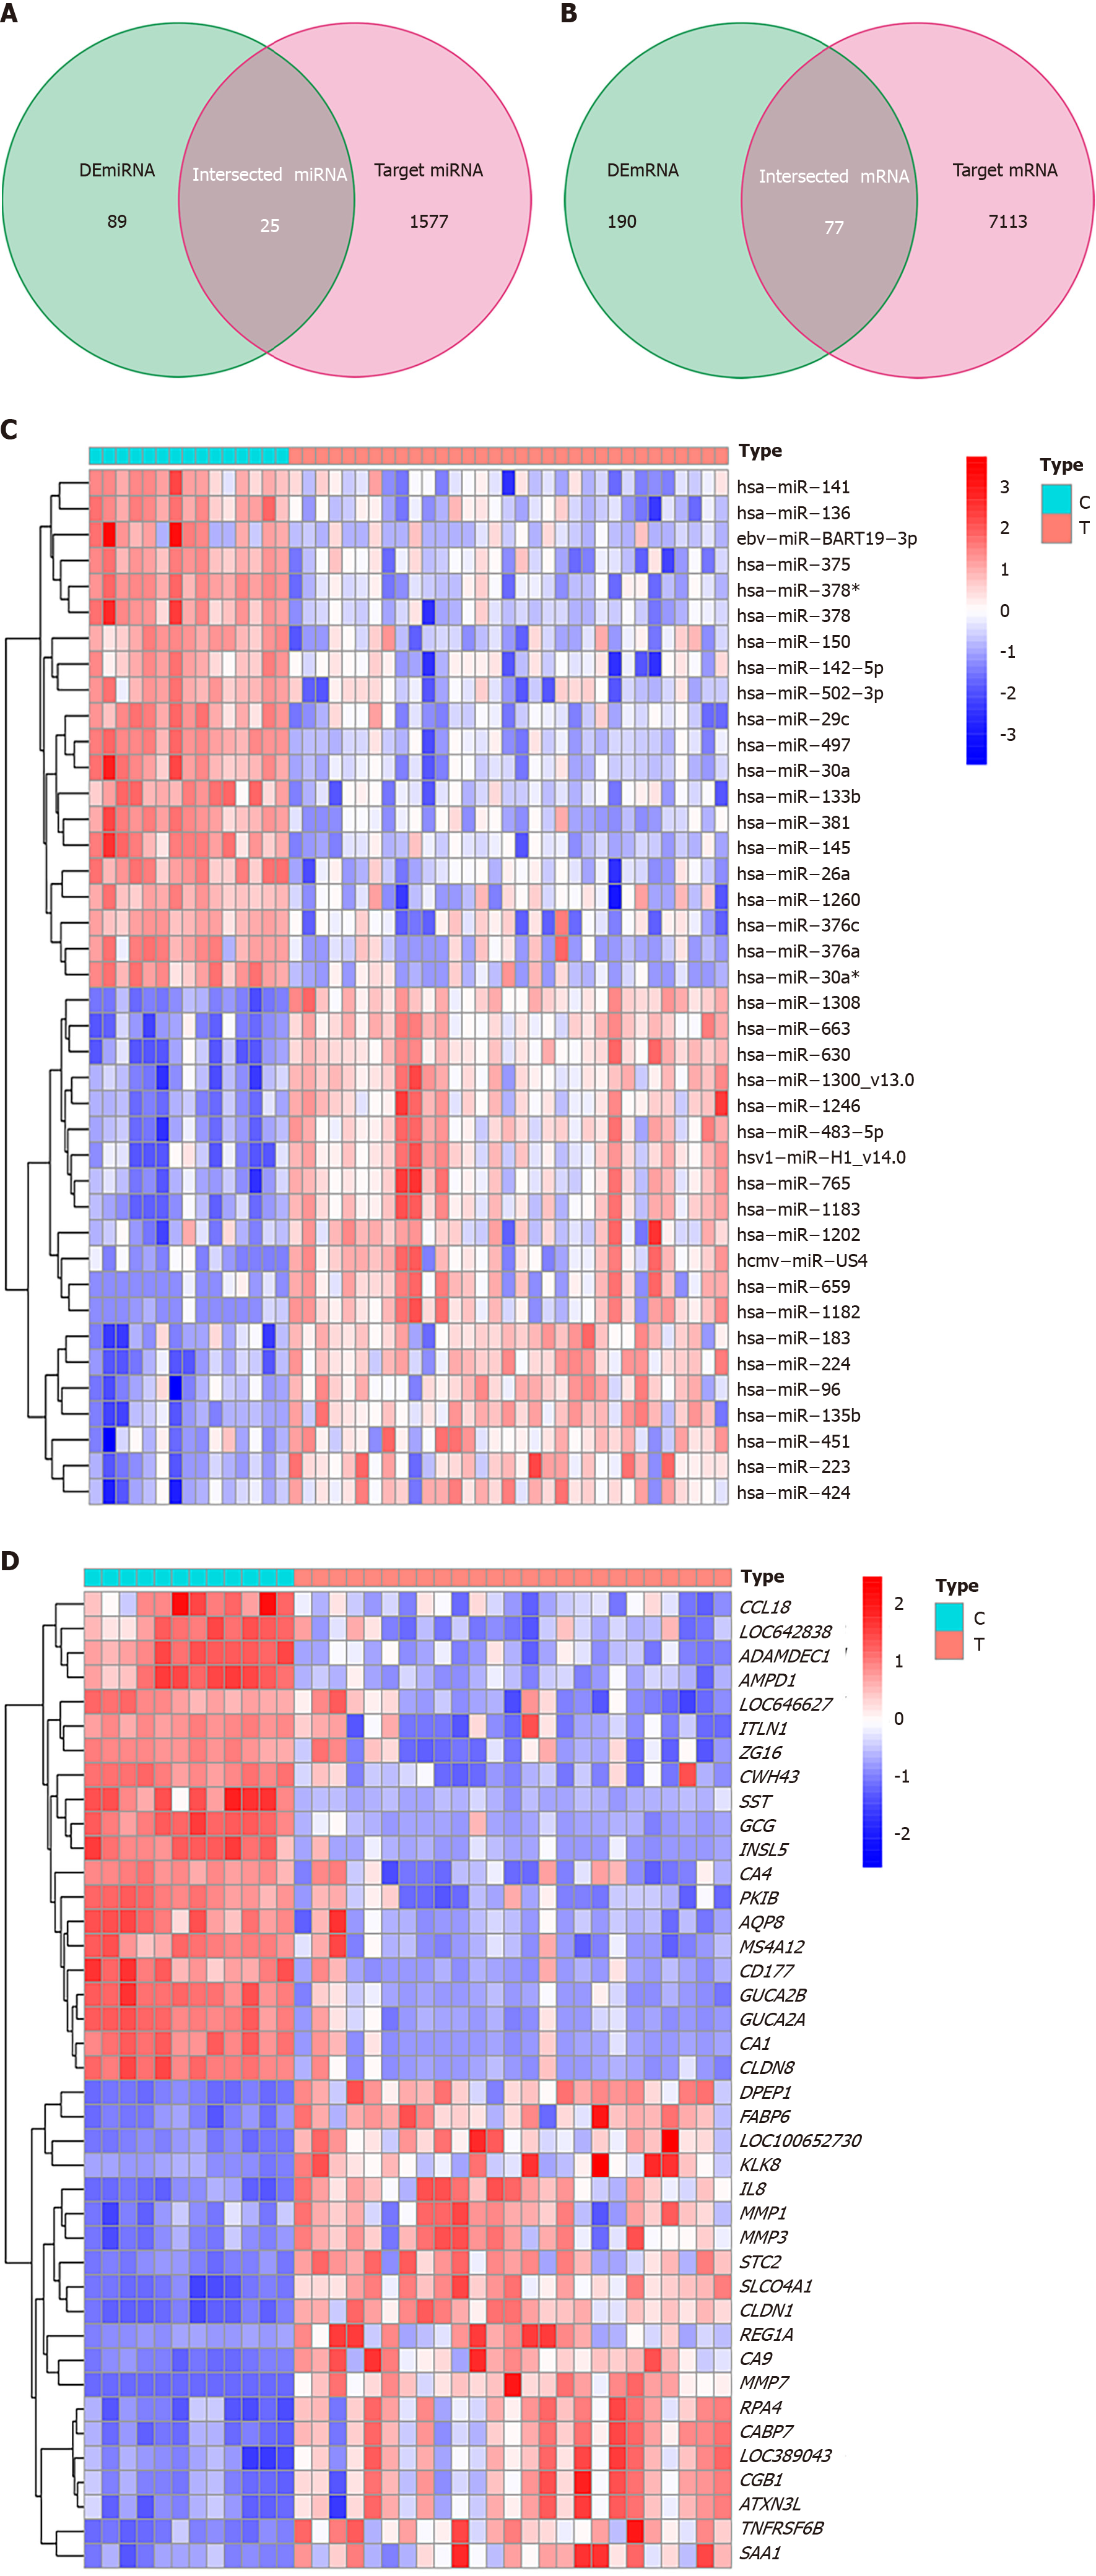
Figure 4 Venn diagrams and heat maps of miRNAs and mRNAs.
A: Twenty-five miRNAs were identified from the intersection of 114 differentially expressed (DE) miRNAs with 1602 circRNA targets predicted by the Cancer-Specific CircRNA Database; B: 77 mRNAs were obtained from the intersection of 267 DEmRNAs and 7190 miRNA targets predicted using the TargetScan and miRDB databases; The expression level of each 20 DEmiRNAs (C) and 20 mRNAs (D) expressing the most significant upregulation and downregulation between control tissues (type C) and tumor tissues (type T), respectively. |log2 fold change (FC)| > 1 and an adjusted P < 0.05 were considered the statistical criteria for DEmiRNA; adjusted P < 0.05 and |log2 FC| > 2 were considered the statistical criteria for DEmRNA.
- Citation: Yin TF, Zhao DY, Zhou YC, Wang QQ, Yao SK. Identification of the circRNA-miRNA-mRNA regulatory network and its prognostic effect in colorectal cancer. World J Clin Cases 2021; 9(18): 4520-4541
- URL: https://www.wjgnet.com/2307-8960/full/v9/i18/4520.htm
- DOI: https://dx.doi.org/10.12998/wjcc.v9.i18.4520


