Copyright
©The Author(s) 2021.
World J Clin Cases. Jun 16, 2021; 9(17): 4143-4158
Published online Jun 16, 2021. doi: 10.12998/wjcc.v9.i17.4143
Published online Jun 16, 2021. doi: 10.12998/wjcc.v9.i17.4143
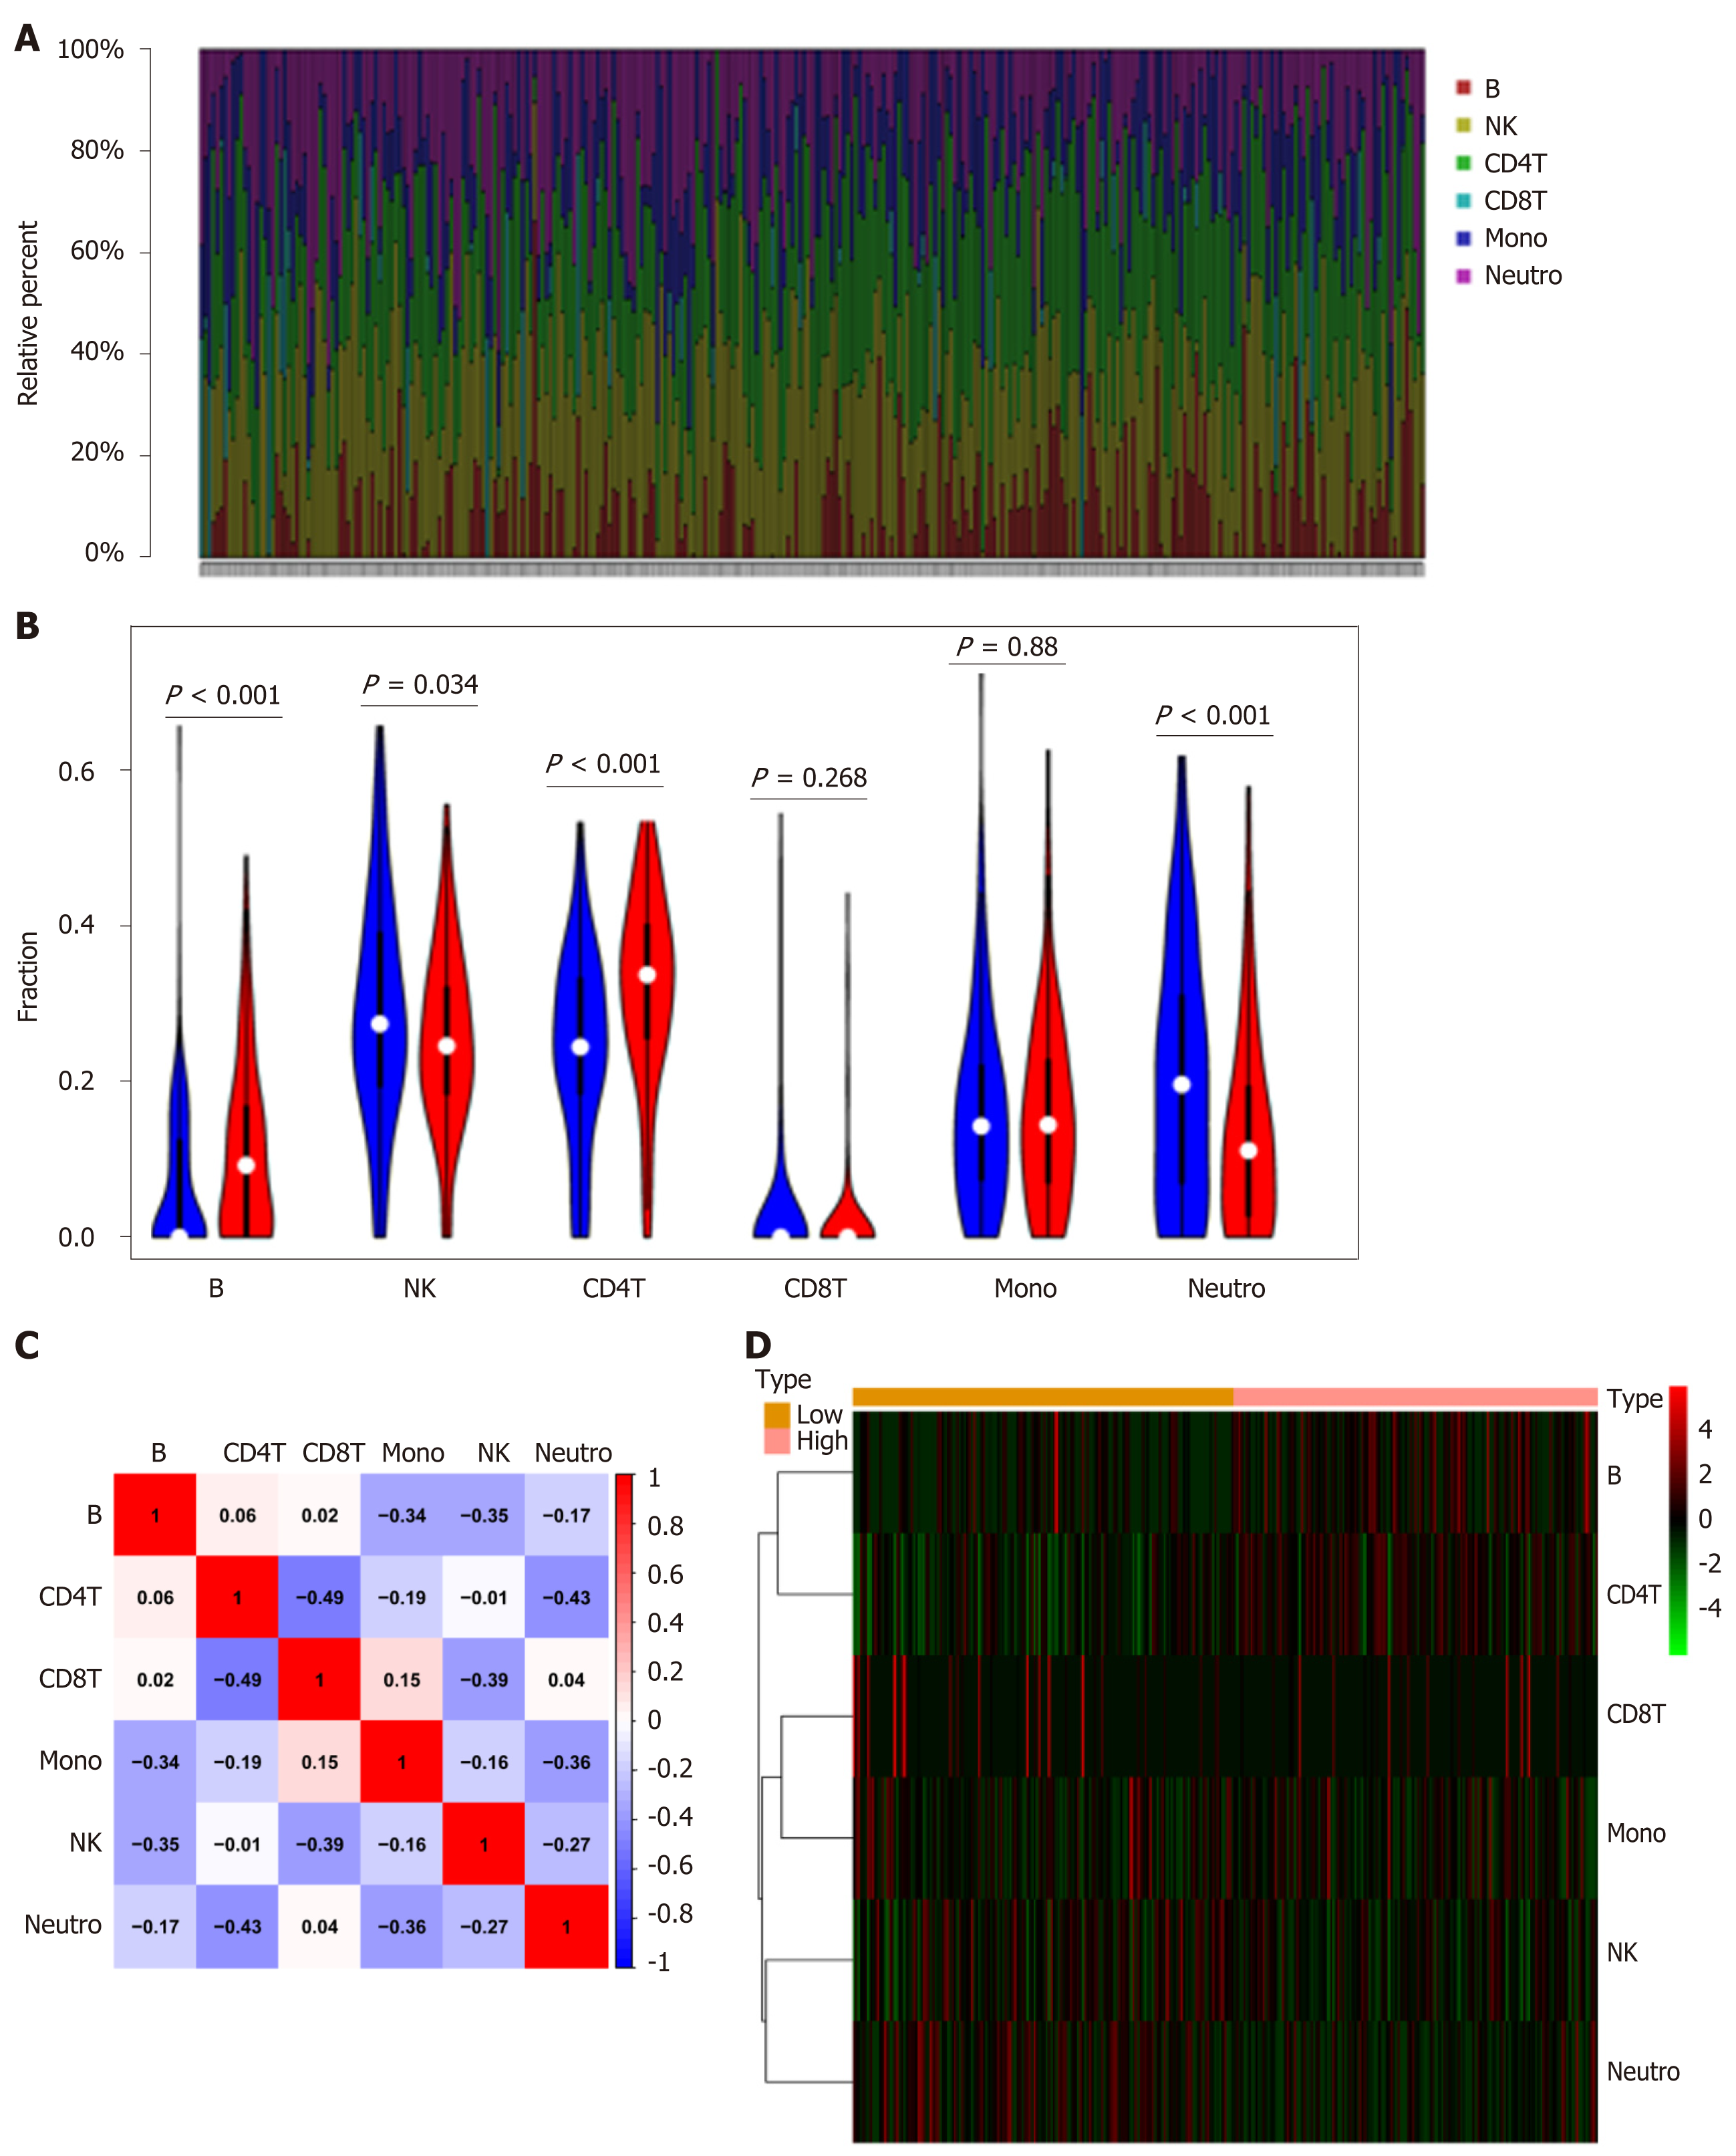
Figure 5 NPY1R and immune infiltration.
A: The 6 immune cell types in each sample are shown in bar plots; B: The violin plot showing the differences in 6 immune cell types between the two groups; C: The correlation matrix demonstrated the correlations of 6 immune cell types; D: Heatmap revealing the distribution of 6 immune cell types in the two groups. NK: Natural killer; Mono: Monoclonal; Neutro: Neutrophil.
- Citation: Huang YJ, Cao ZF, Wang J, Yang J, Wei YJ, Tang YC, Cheng YX, Zhou J, Zhang ZX. Why MUC16 mutations lead to a better prognosis: A study based on The Cancer Genome Atlas gastric cancer cohort. World J Clin Cases 2021; 9(17): 4143-4158
- URL: https://www.wjgnet.com/2307-8960/full/v9/i17/4143.htm
- DOI: https://dx.doi.org/10.12998/wjcc.v9.i17.4143


