Copyright
©The Author(s) 2021.
World J Clin Cases. Jun 16, 2021; 9(17): 4143-4158
Published online Jun 16, 2021. doi: 10.12998/wjcc.v9.i17.4143
Published online Jun 16, 2021. doi: 10.12998/wjcc.v9.i17.4143
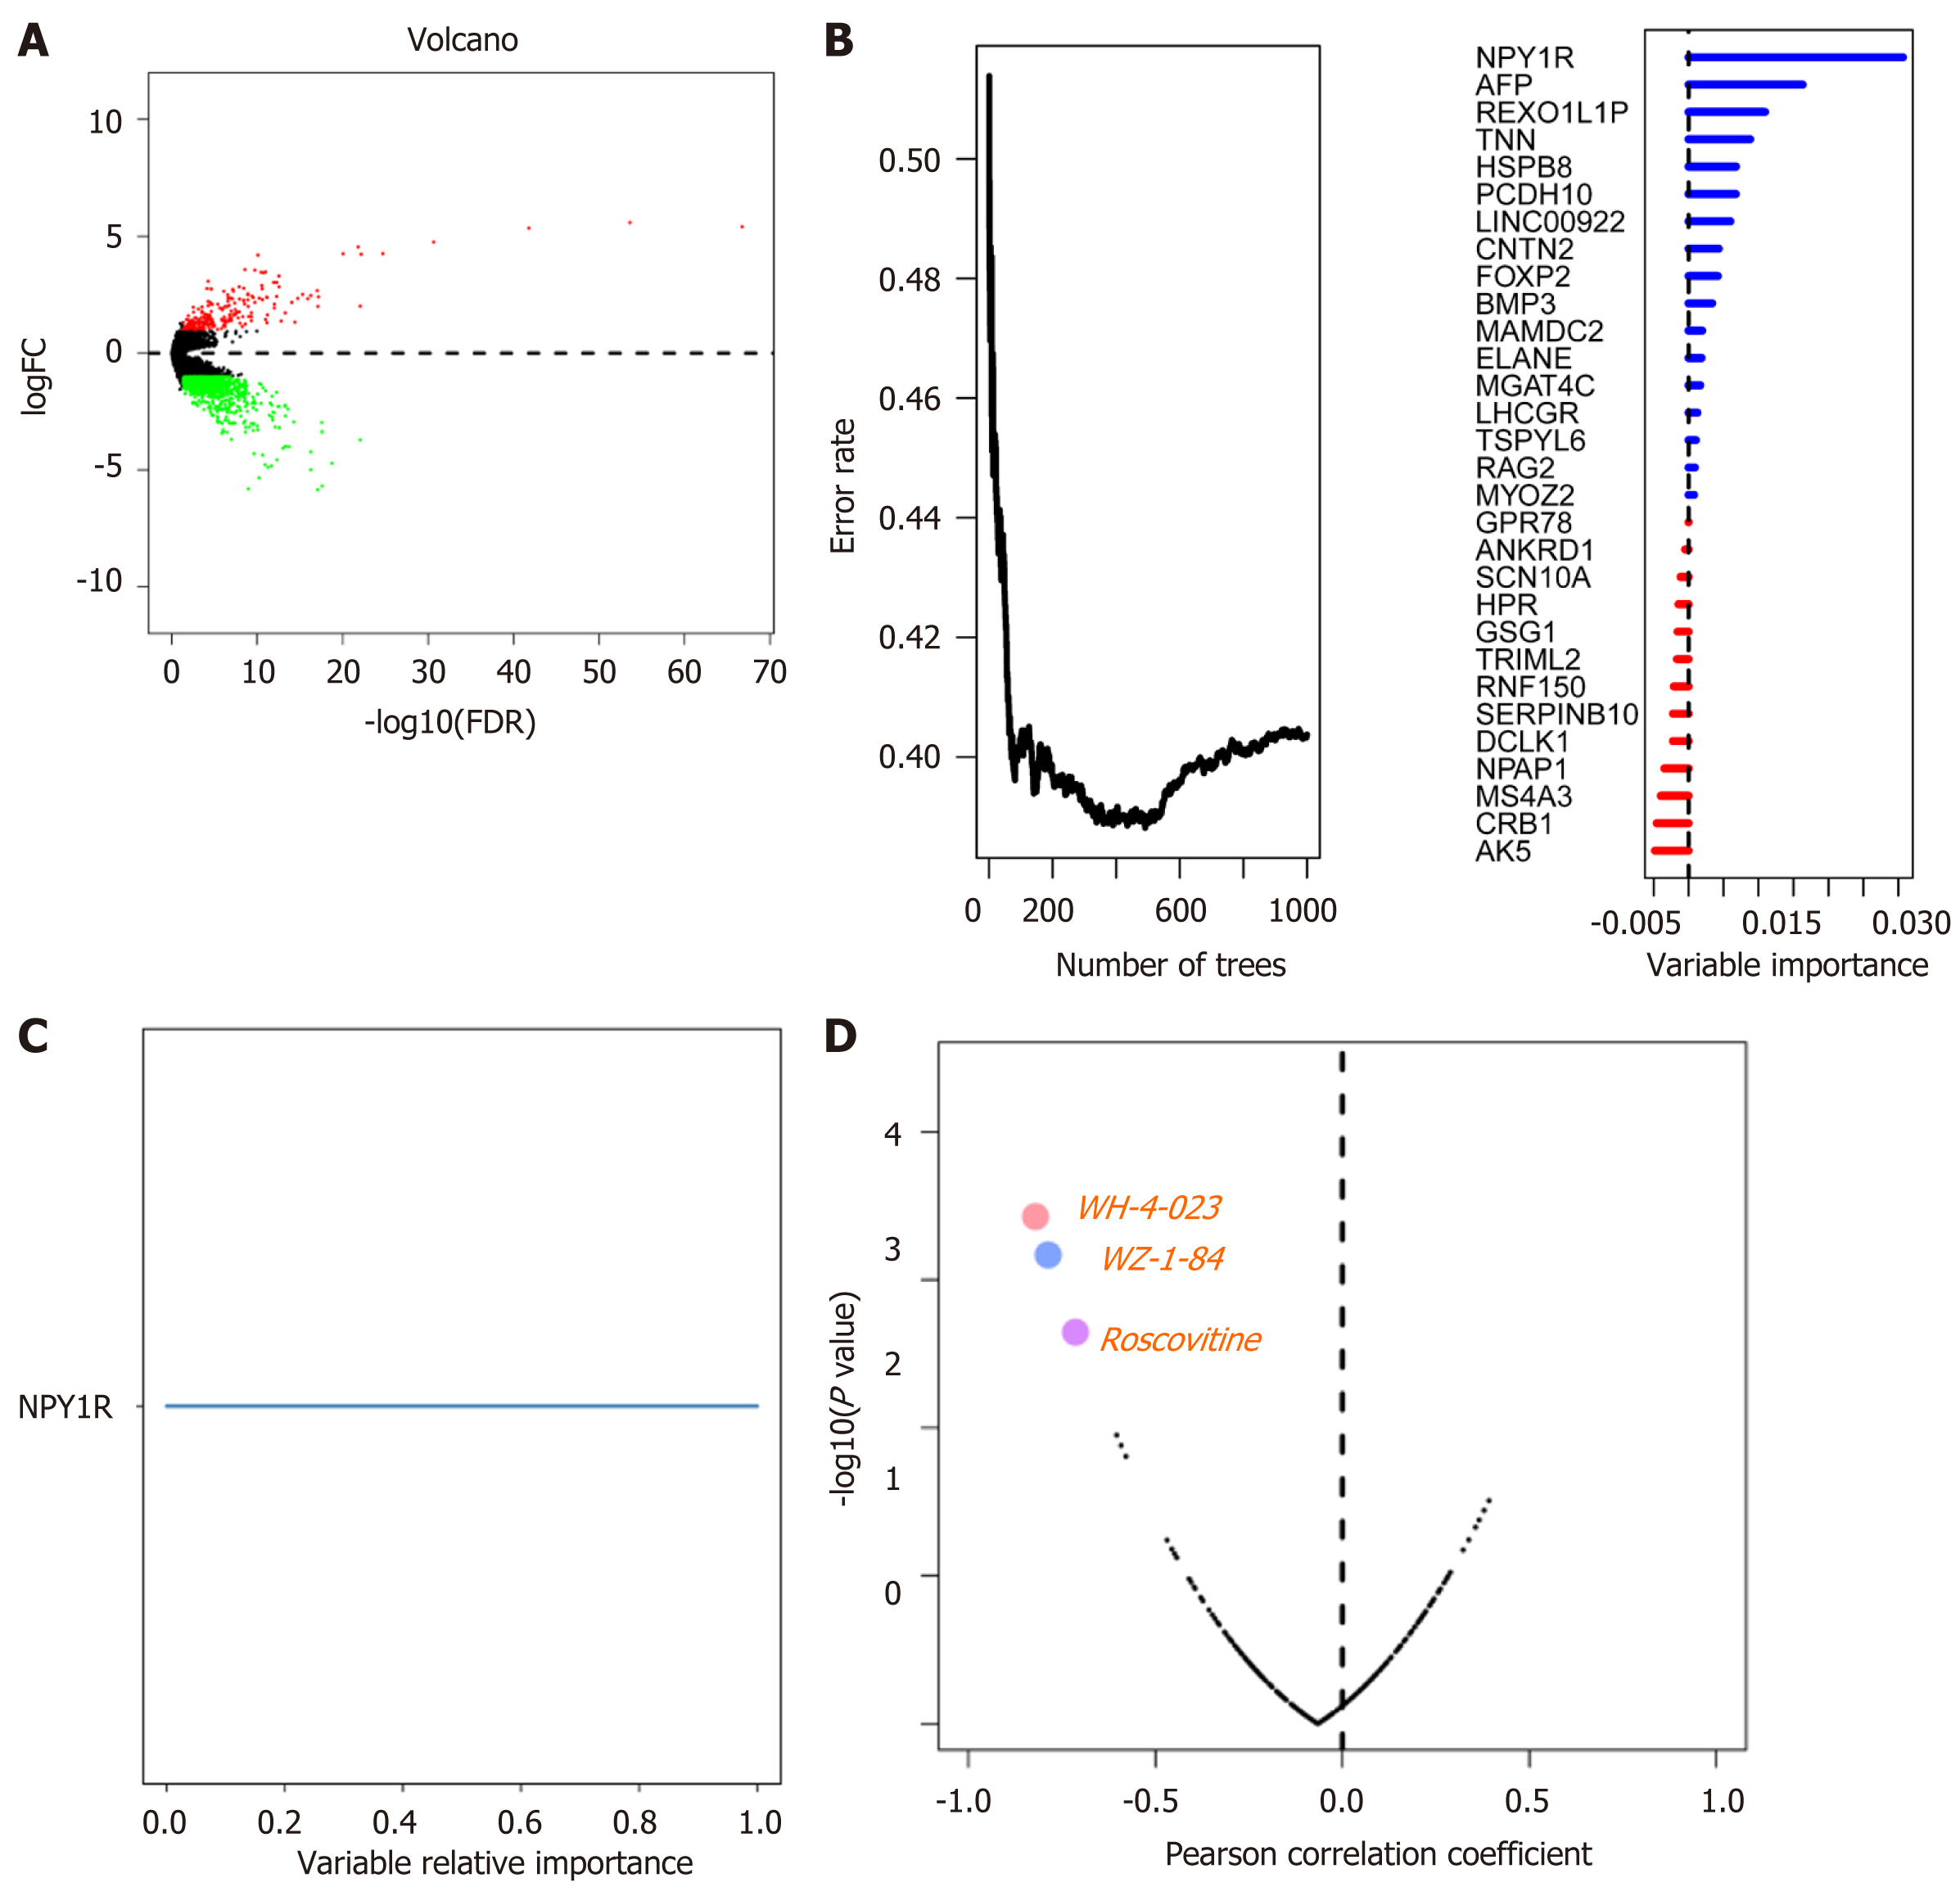
Figure 3 Differentially expressed genes and drug sensitivity.
A: Volcano plot showing differentially expressed genes between the MUC16 mutation group and the MUC16 wild-type group, up-regulated genes are in red, down-regulated genes are in green, and black represents genes that are not differentially expressed; B: Error rate for the data as a function of the classification tree and out-of-bag importance values for the predictors; C: Genes of relative importance greater than 0.65; D: The plot showing the correlation between NPY1R expression and the sensitivity of gastric cancer cell lines to various drugs, with the three most negatively correlated drugs being WH-4-023, WZ-184, and Roscovitine. NPY1R: Neuropeptide Y receptor Y1.
- Citation: Huang YJ, Cao ZF, Wang J, Yang J, Wei YJ, Tang YC, Cheng YX, Zhou J, Zhang ZX. Why MUC16 mutations lead to a better prognosis: A study based on The Cancer Genome Atlas gastric cancer cohort. World J Clin Cases 2021; 9(17): 4143-4158
- URL: https://www.wjgnet.com/2307-8960/full/v9/i17/4143.htm
- DOI: https://dx.doi.org/10.12998/wjcc.v9.i17.4143


