Copyright
©The Author(s) 2021.
World J Clin Cases. Jun 16, 2021; 9(17): 4143-4158
Published online Jun 16, 2021. doi: 10.12998/wjcc.v9.i17.4143
Published online Jun 16, 2021. doi: 10.12998/wjcc.v9.i17.4143
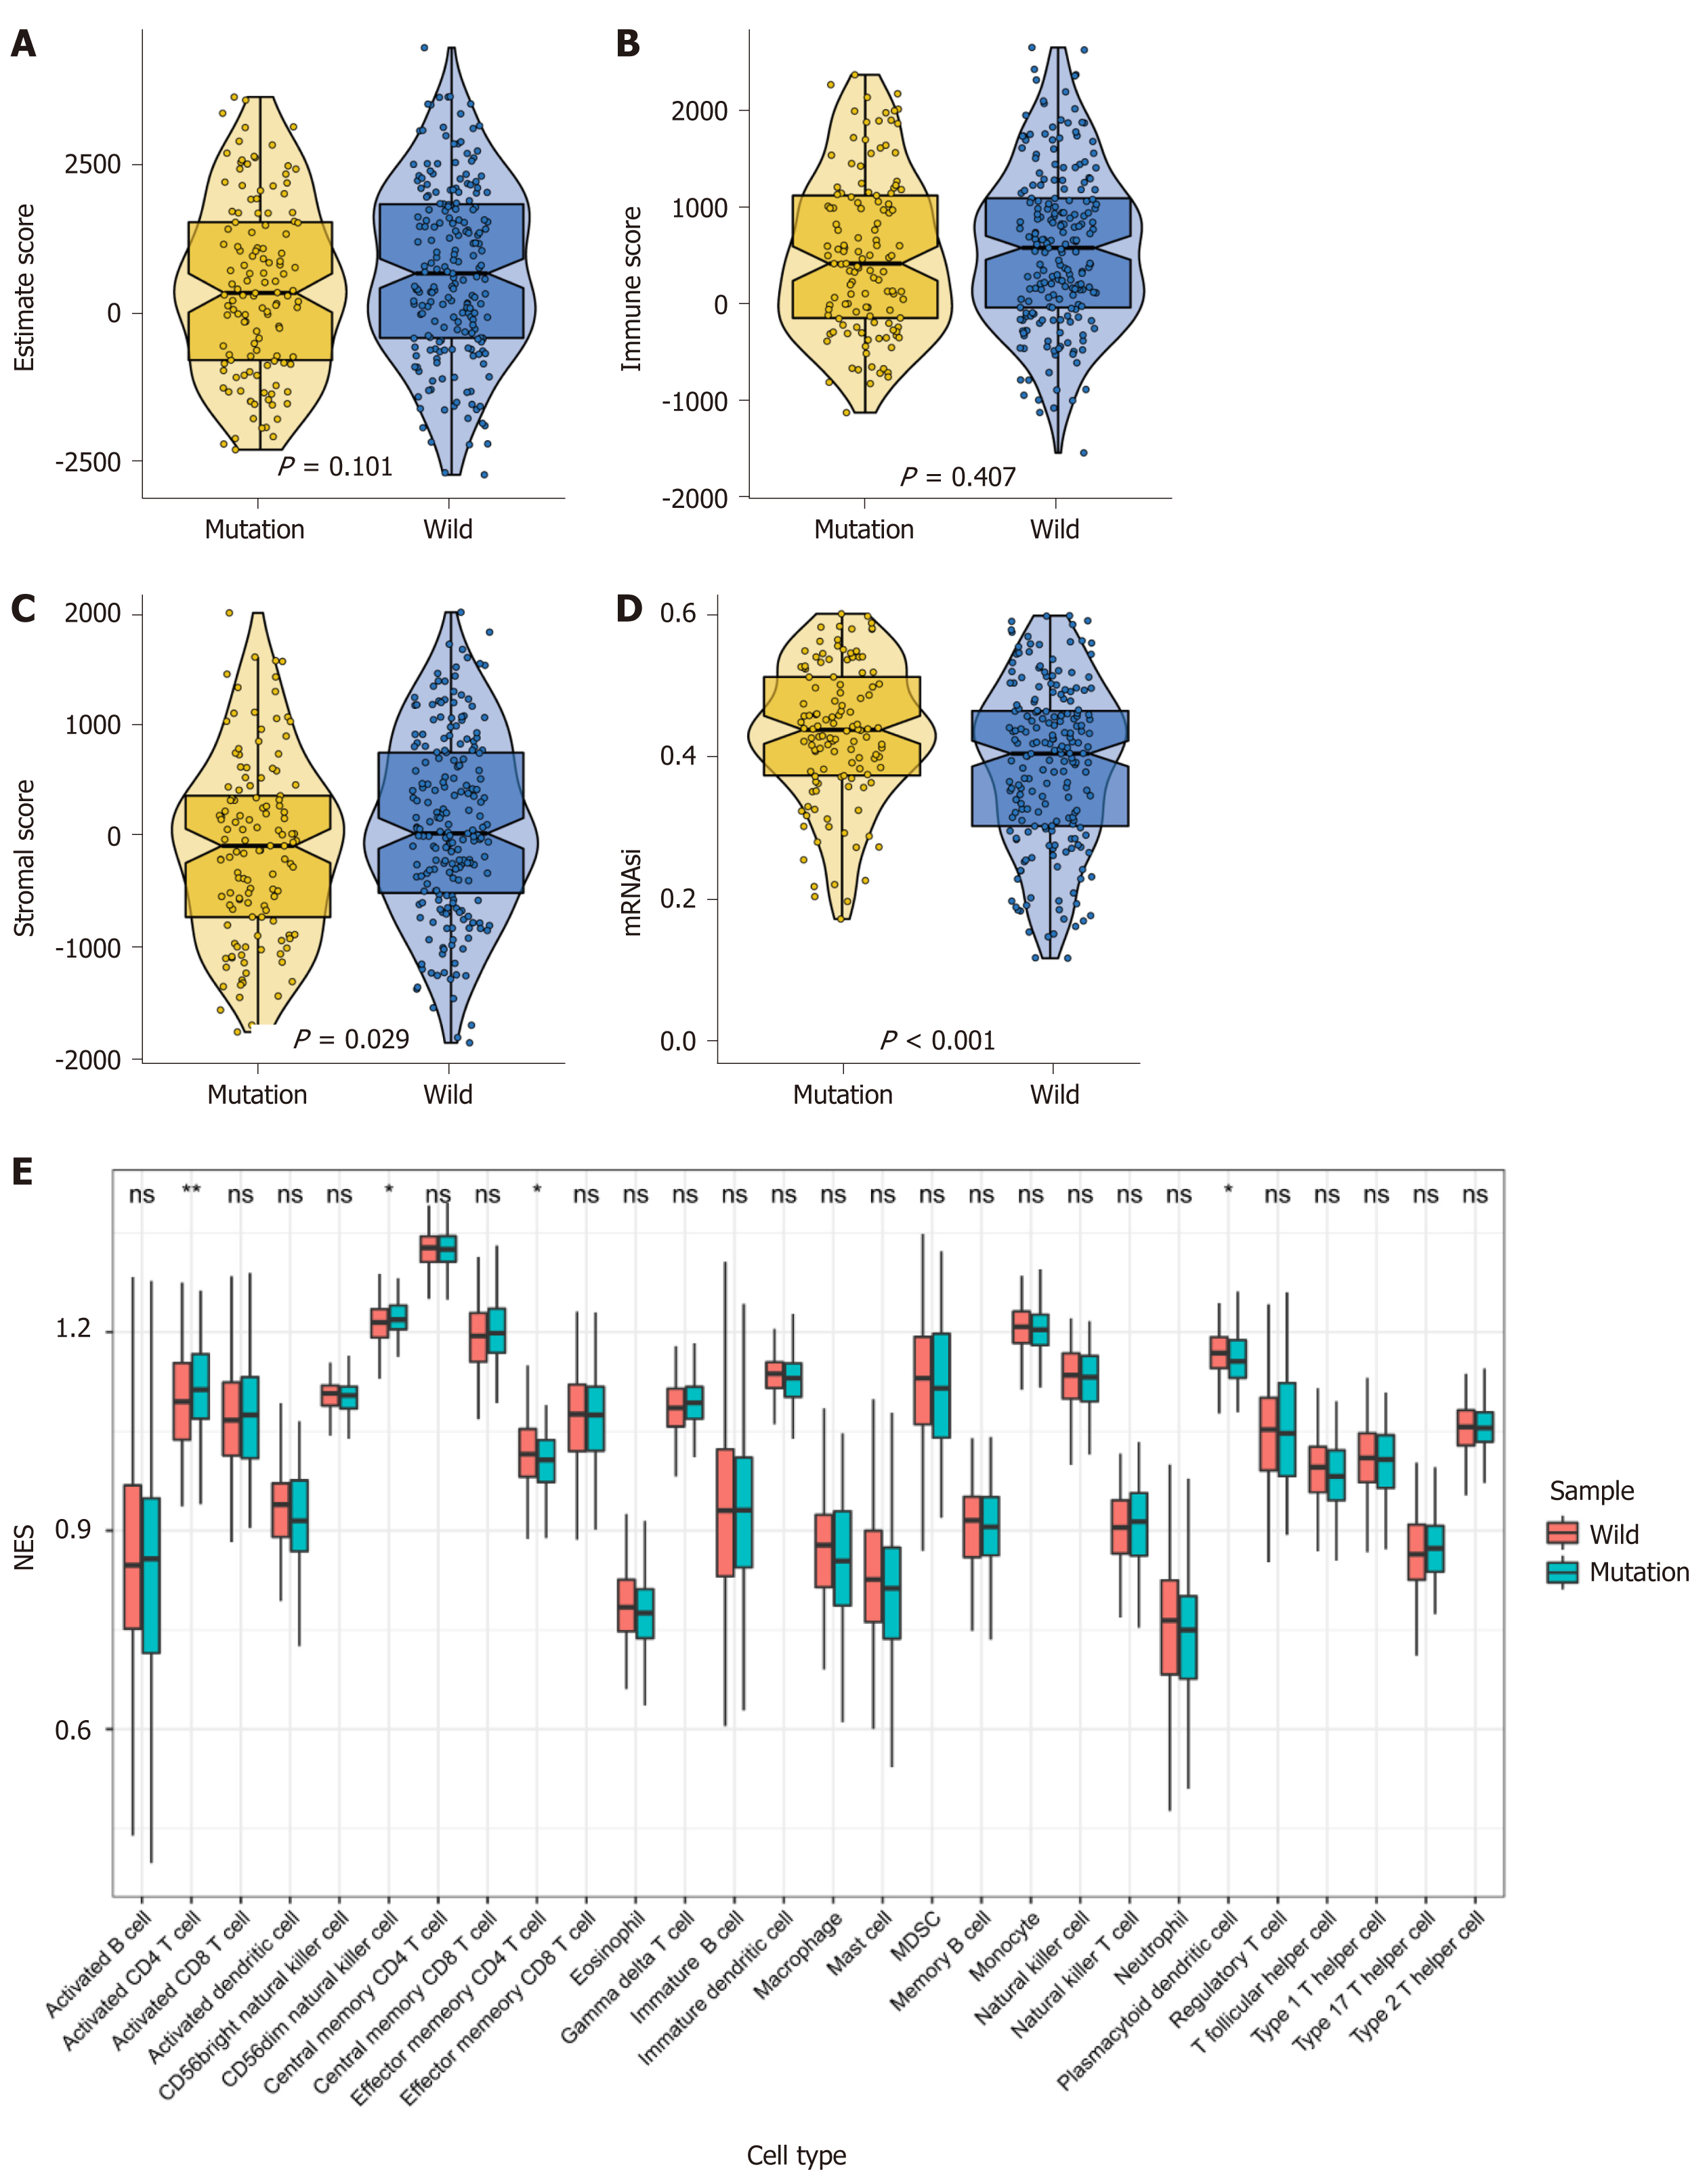
Figure 2 MUC16 mutations and the tumor microenvironment.
A-C: Violin plot showing tumor purity, immune score, and stromal score, respectively; D: Boxplot showing the difference in cancer stem cell index between the two groups; E: The infiltration of 28 immune cells in tumors was assessed using single-sample gene set enrichment analysis, red represents the mutation group and blue represents the wild-type group.
- Citation: Huang YJ, Cao ZF, Wang J, Yang J, Wei YJ, Tang YC, Cheng YX, Zhou J, Zhang ZX. Why MUC16 mutations lead to a better prognosis: A study based on The Cancer Genome Atlas gastric cancer cohort. World J Clin Cases 2021; 9(17): 4143-4158
- URL: https://www.wjgnet.com/2307-8960/full/v9/i17/4143.htm
- DOI: https://dx.doi.org/10.12998/wjcc.v9.i17.4143


