Copyright
©The Author(s) 2021.
World J Clin Cases. Jun 16, 2021; 9(17): 4143-4158
Published online Jun 16, 2021. doi: 10.12998/wjcc.v9.i17.4143
Published online Jun 16, 2021. doi: 10.12998/wjcc.v9.i17.4143
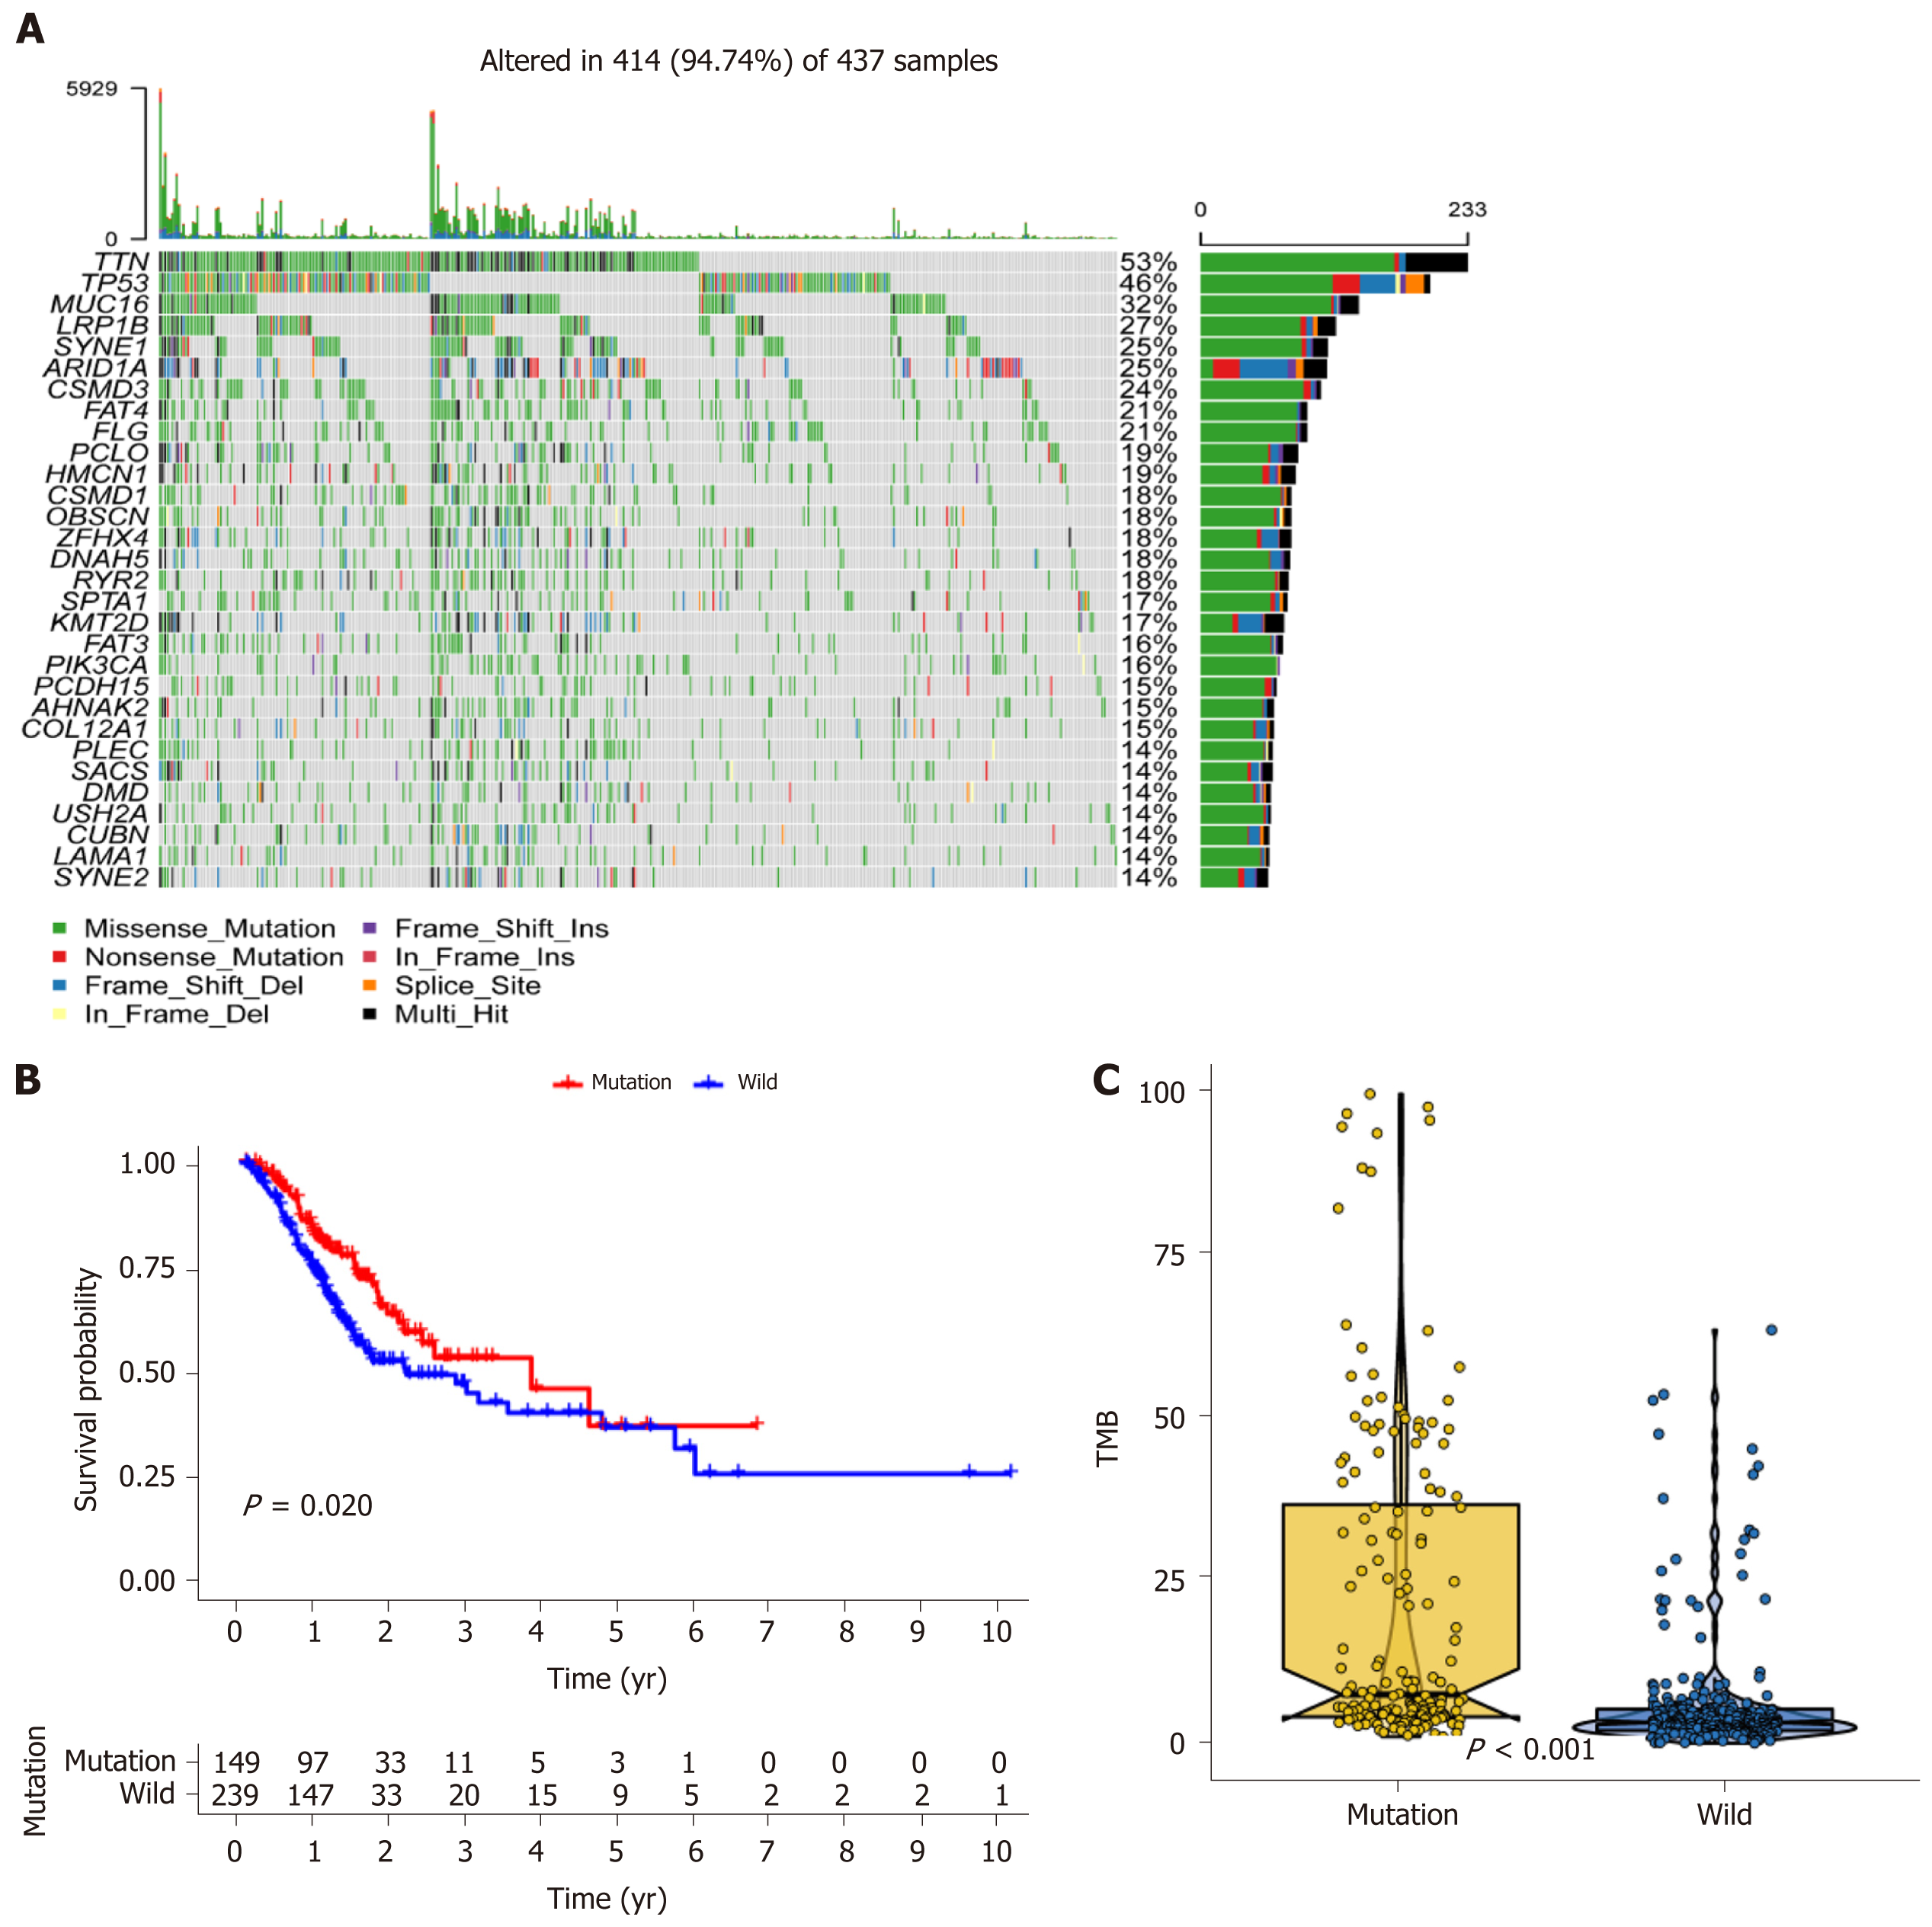
Figure 1 MUC16 mutations in relation to prognosis and tumor mutation burden.
A: Waterfall plot showing the mutation information for each gene. Each color represents a type of mutation; B: Kaplan-Meier survival analysis was used to assess prognosis, with red representing the mutation group and blue representing the wild-type group; C: Boxplot showing the tumor mutation burden scores in the two groups. TMB: Tumor mutation burden.
- Citation: Huang YJ, Cao ZF, Wang J, Yang J, Wei YJ, Tang YC, Cheng YX, Zhou J, Zhang ZX. Why MUC16 mutations lead to a better prognosis: A study based on The Cancer Genome Atlas gastric cancer cohort. World J Clin Cases 2021; 9(17): 4143-4158
- URL: https://www.wjgnet.com/2307-8960/full/v9/i17/4143.htm
- DOI: https://dx.doi.org/10.12998/wjcc.v9.i17.4143


