Copyright
©The Author(s) 2021.
World J Clin Cases. May 16, 2021; 9(14): 3403-3410
Published online May 16, 2021. doi: 10.12998/wjcc.v9.i14.3403
Published online May 16, 2021. doi: 10.12998/wjcc.v9.i14.3403
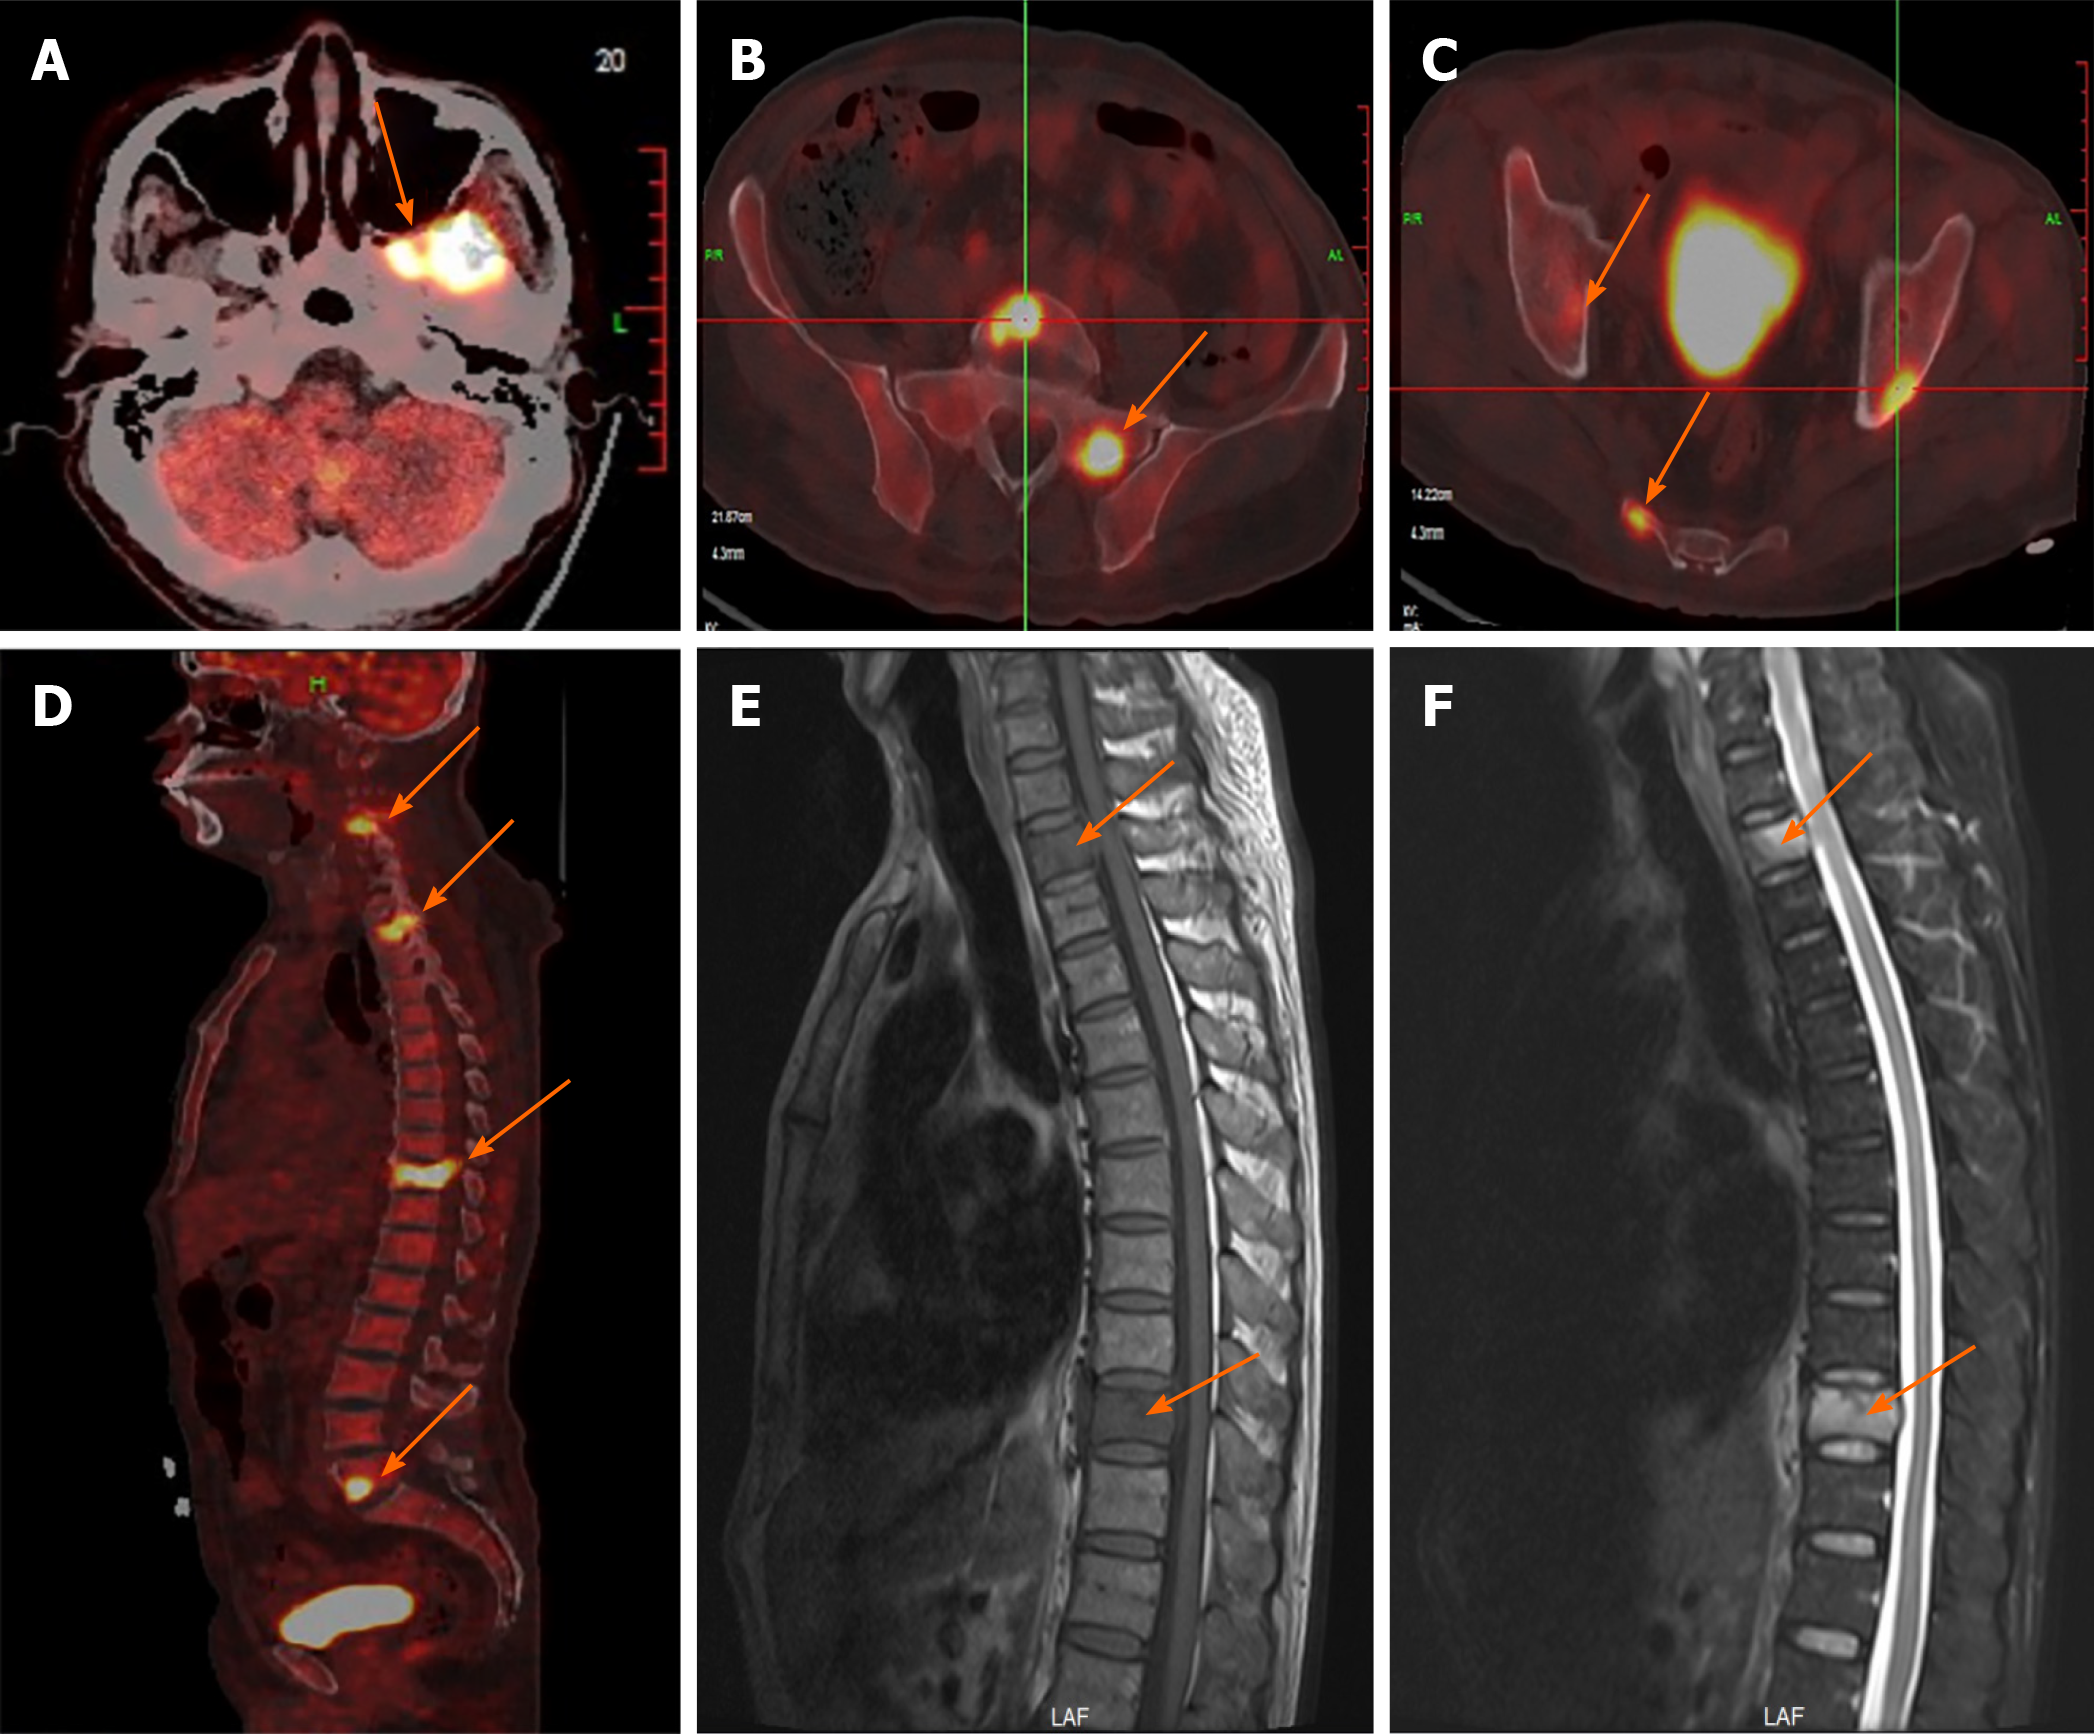
Figure 2 Thoracic magnetic resonance imaging.
A and B: Thoracic enhanced magnetic resonance imaging showed obvious T2 and T10 vertebral bone destruction (orange arrows); C-F: Positron emission tomography-computed tomography showed increased 18F-fluorodeoxyglucose avidity involving the left sphenoid wing, the C4-5, T2, T10, L5, S1, and S5 vertebrae; the right humeral head, both sides of the humerus, and the right proximal femur. Multiple osteolytic lesions were identified as hypermetabolic lesions with a maximum standard uptake value of 18.64; different degrees of bone destruction can be observed in corresponding sites (orange arrows).
- Citation: Zheng W, Yin QQ, Hui TC, Wu WH, Wu QQ, Huang HJ, Chen MJ, Yan R, Huang YC, Pan HY. Primary bone anaplastic lymphoma kinase positive anaplastic large-cell lymphoma: A case report and review of the literature . World J Clin Cases 2021; 9(14): 3403-3410
- URL: https://www.wjgnet.com/2307-8960/full/v9/i14/3403.htm
- DOI: https://dx.doi.org/10.12998/wjcc.v9.i14.3403


