Copyright
©The Author(s) 2021.
World J Clin Cases. Apr 6, 2021; 9(10): 2312-2319
Published online Apr 6, 2021. doi: 10.12998/wjcc.v9.i10.2312
Published online Apr 6, 2021. doi: 10.12998/wjcc.v9.i10.2312
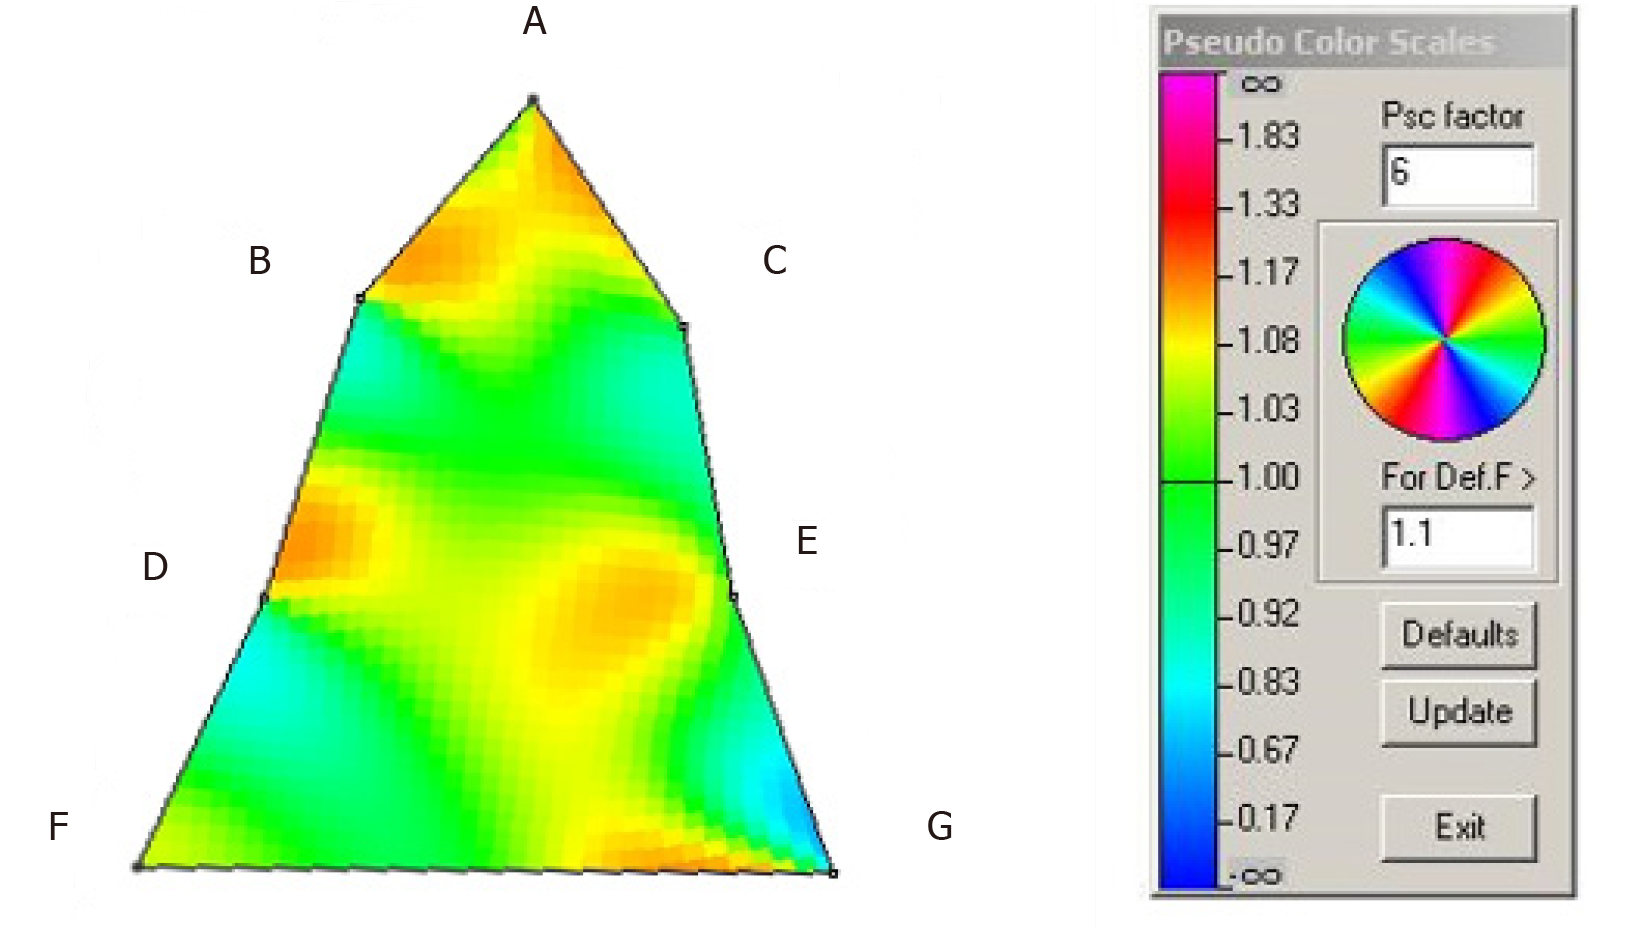
Figure 6 Finite-element analysis of the pre- and post-treatment upper arch.
Note the pseudocolor scale indicates a localized size increases of 15%-20% in the incisal region, 15%-17% in the premolar regions and 15%-23% in the molar regions (orange-yellow coloration). Node A: Contact point of central incisors in midline at incisive papilla; Node B: Medial-most point on cingulum of right cuspid at cervical margin; Node C: Medial-most point on cingulum of left cuspid at cervical margin; Node D: Medial-most point on palatal cusp of right second premolar at cervical margin; Node E: Medial-most point on palatal cusp of left second premolar at cervical margin; Node F: Medial-most point of mesio-palatal cusps of right first molar at cervical margin; and Node G: Medial-most point of mesio-palatal cusps of right first molar at cervical margin.
- Citation: Singh GD, Kherani S. Changes in sleep parameters following biomimetic oral appliance therapy: A case report. World J Clin Cases 2021; 9(10): 2312-2319
- URL: https://www.wjgnet.com/2307-8960/full/v9/i10/2312.htm
- DOI: https://dx.doi.org/10.12998/wjcc.v9.i10.2312


