Copyright
©The Author(s) 2021.
World J Clin Cases. Jan 6, 2021; 9(1): 170-174
Published online Jan 6, 2021. doi: 10.12998/wjcc.v9.i1.170
Published online Jan 6, 2021. doi: 10.12998/wjcc.v9.i1.170
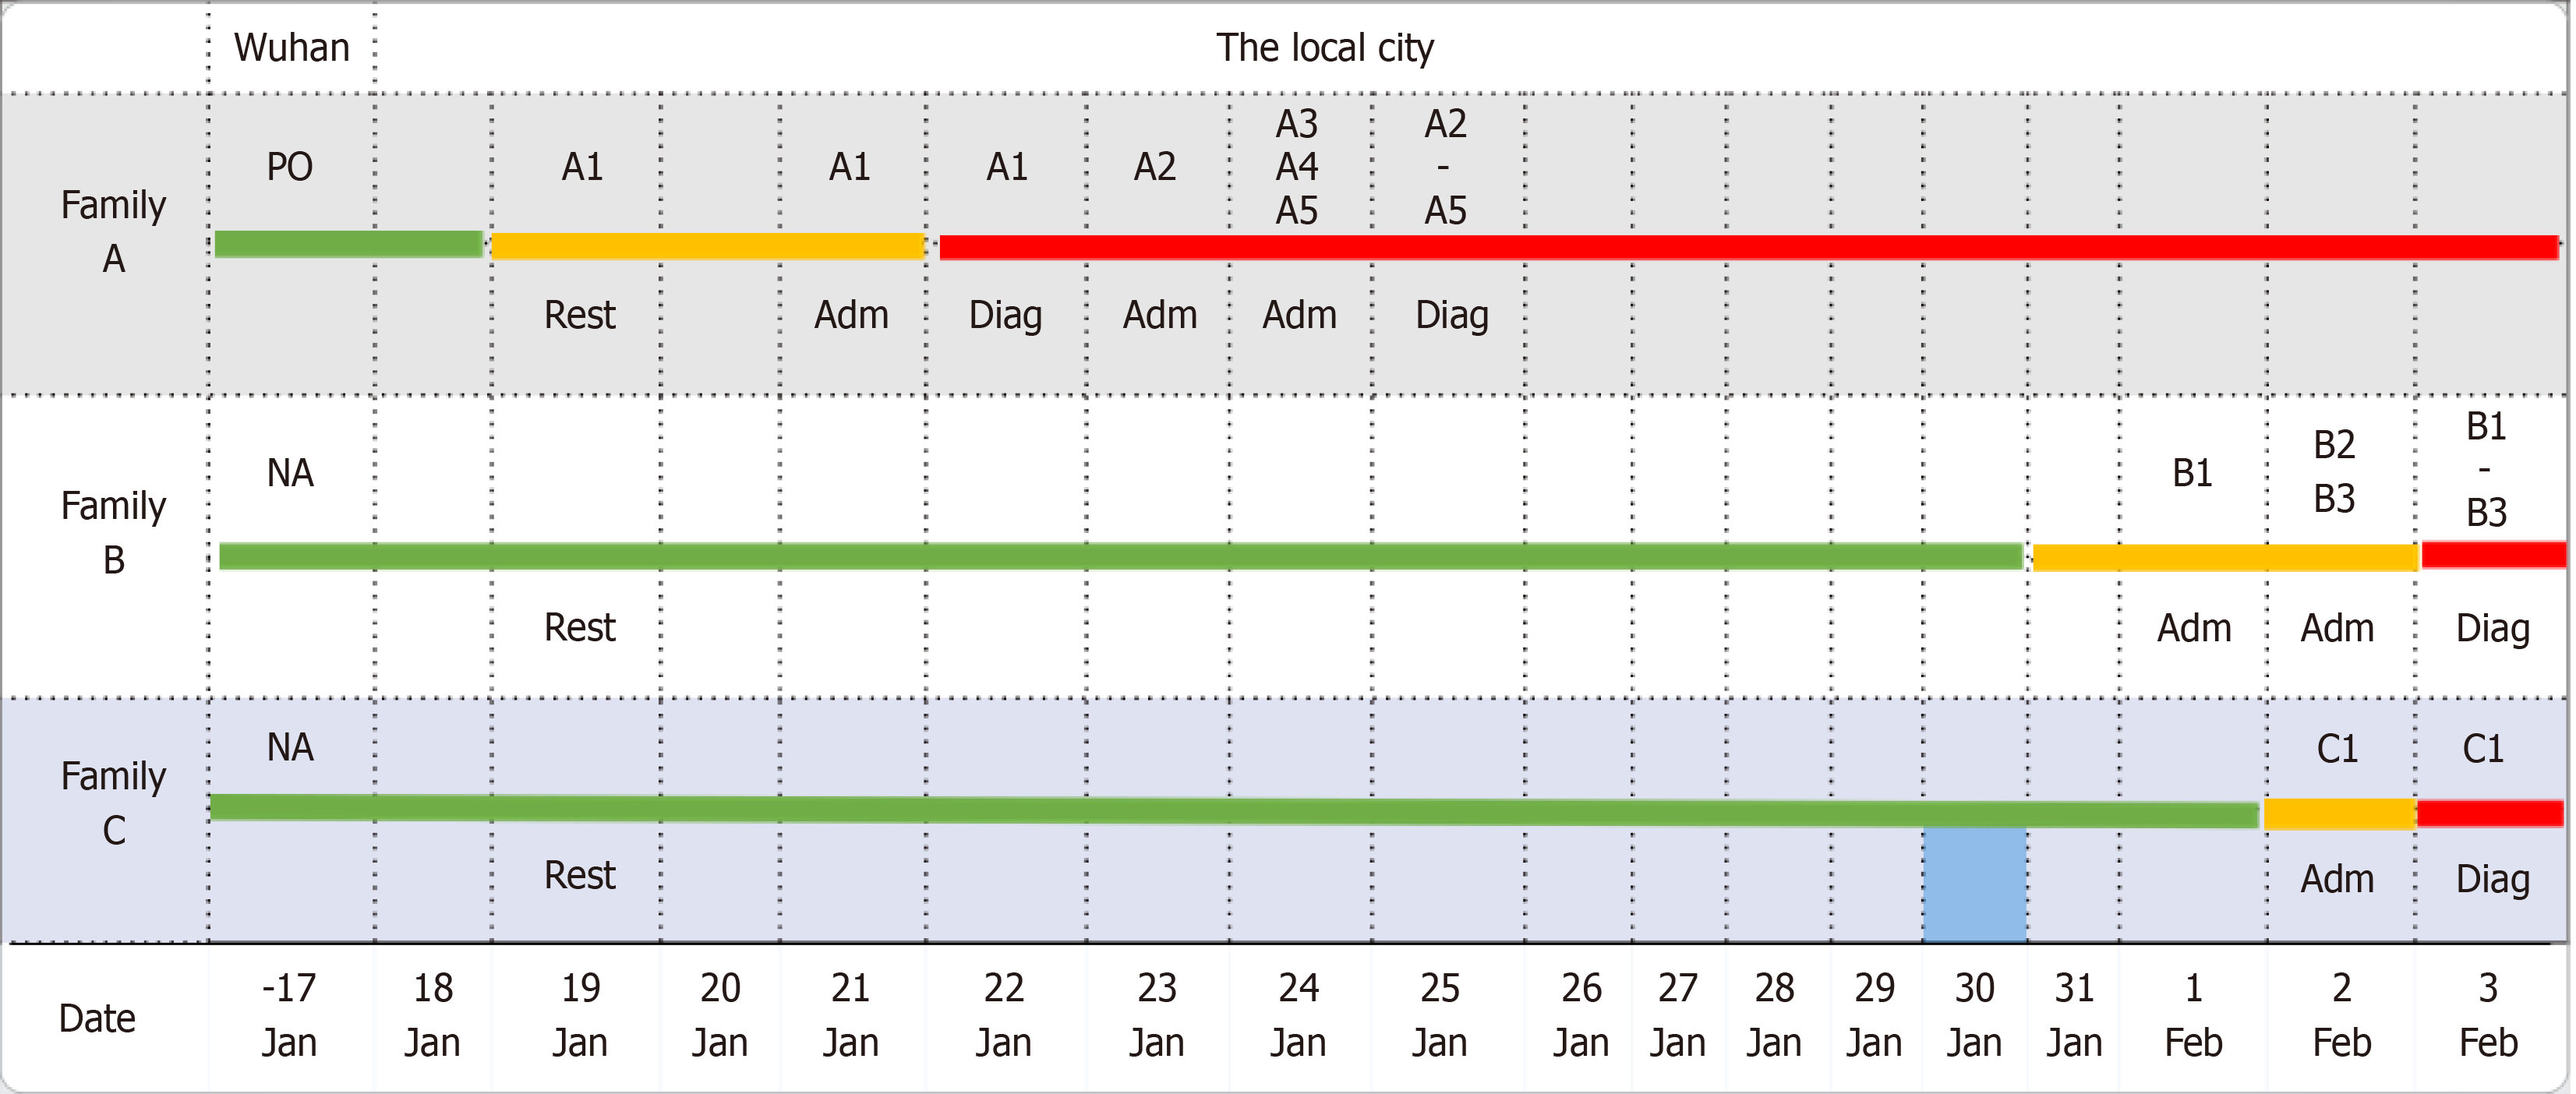
Figure 2 Epidemiological investigations showing a group aggregative infection pattern.
Green, yellow, and red colors represent a normal condition, a potential risk condition, and a risk condition, respectively. On January 19, 2020, three families, unknown to each other, dined at the same place. “Admitted” indicates individuals from each family who were in-hospital; “Diagnosed” indicates individuals from each family who were confirmed as having coronavirus disease 2019 by laboratory testing. A1, A2, A3, A4, and A5, B1, B2, and B3, and C1 indicate the members from family A, family B, and family C who experienced consecutive illness onset, respectively. Adm: Admitted; Diag: Diagnosed; NA: Negative; PO: Positive; Rest: Restaurant.
- Citation: Zuo H, Hu ZB, Zhu F. Risk of group aggregative behavior during COVID-19 outbreak: A case report. World J Clin Cases 2021; 9(1): 170-174
- URL: https://www.wjgnet.com/2307-8960/full/v9/i1/170.htm
- DOI: https://dx.doi.org/10.12998/wjcc.v9.i1.170


