Copyright
©The Author(s) 2020.
World J Clin Cases. Mar 6, 2020; 8(5): 980-985
Published online Mar 6, 2020. doi: 10.12998/wjcc.v8.i5.980
Published online Mar 6, 2020. doi: 10.12998/wjcc.v8.i5.980
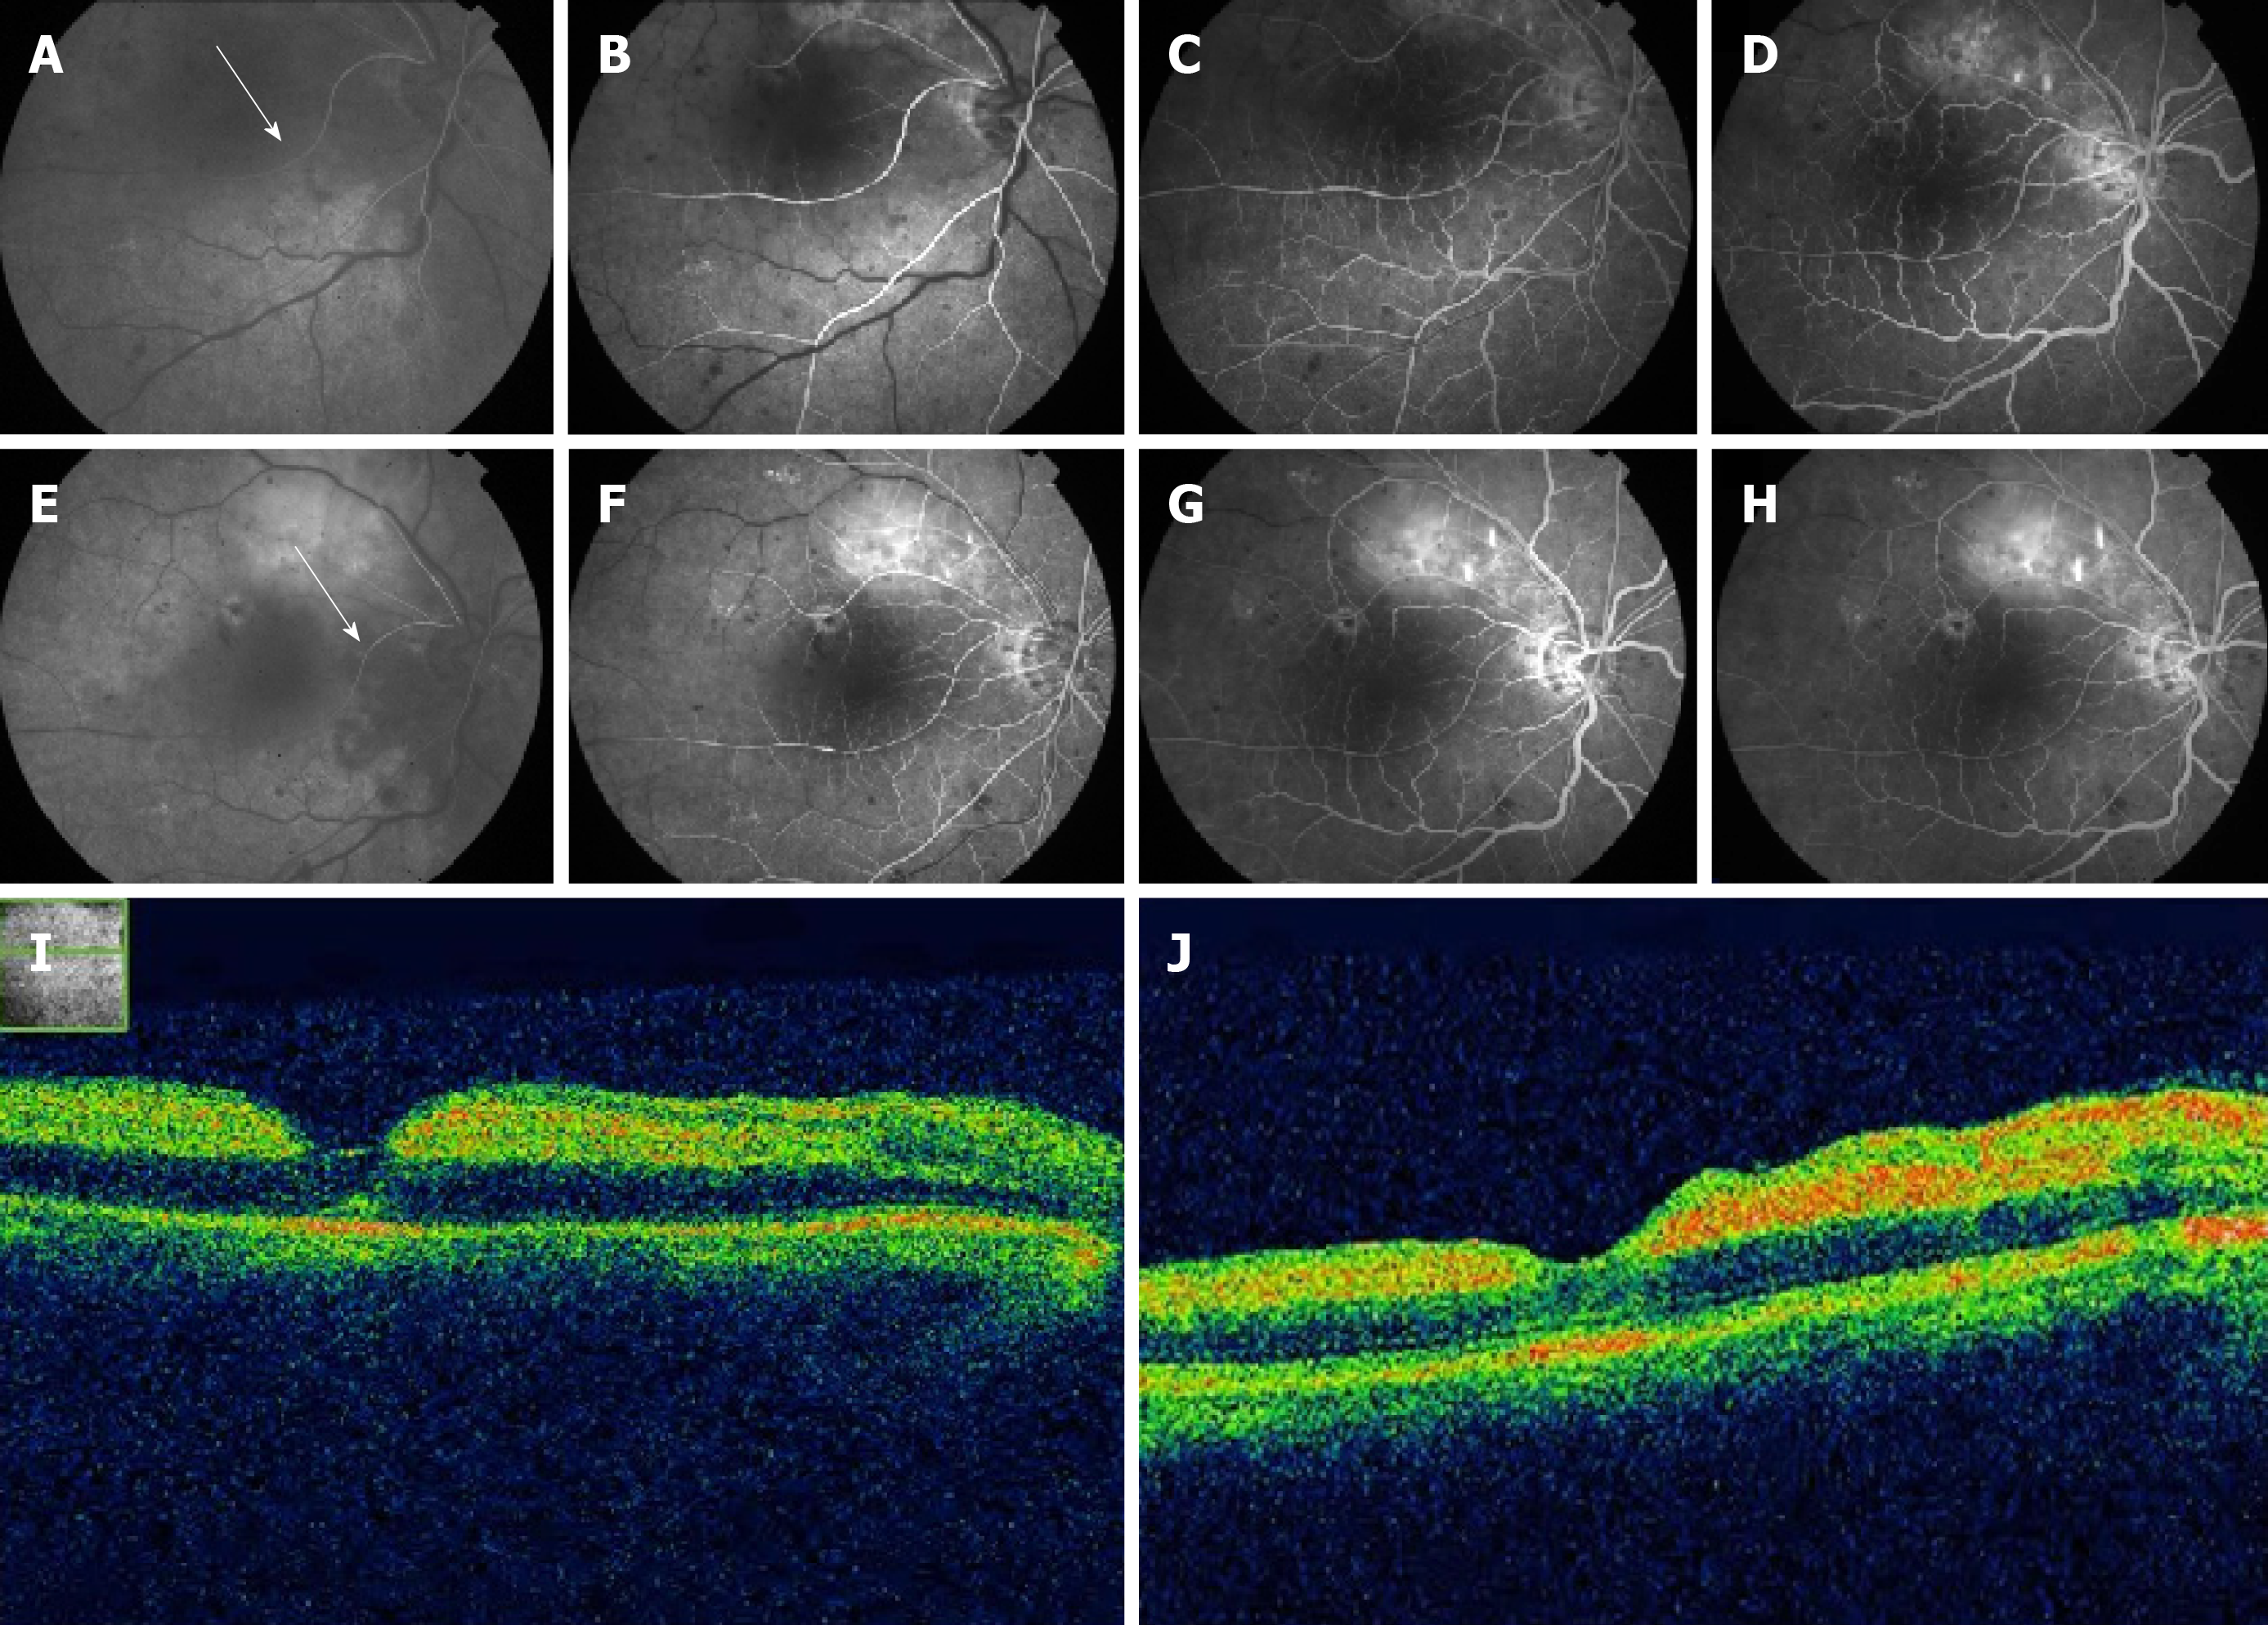
Figure 3 Fundus fluorescein angiography and optical coherence tomography images for the right eye.
A: Fundus fluorescein angiography images obtained at 23 s; B: 30 s; C: 40 s; D: 50 s. The images show that the inferior temporal branch (arrow) is supplied by a branch from a superior temporal artery, with disc leakage and delayed filling time; E: Fundus fluorescein angiography images obtained at the 1-wk follow-up visit, at 18 s; F: 30 s; G: 40 s; H: 50 s; I: Optical coherence tomography demonstrates the presence of subretinal fluid and depicts the underlying layers of the fovea at presentation; J: At 1-wk follow-up.
- Citation: Yang WJ, Yang YN, Cai MG, Xing YQ. Anomalous retinal artery associated with branch retinal artery occlusion and neovascular glaucoma: A case report. World J Clin Cases 2020; 8(5): 980-985
- URL: https://www.wjgnet.com/2307-8960/full/v8/i5/980.htm
- DOI: https://dx.doi.org/10.12998/wjcc.v8.i5.980


