Copyright
©The Author(s) 2020.
World J Clin Cases. Mar 6, 2020; 8(5): 887-899
Published online Mar 6, 2020. doi: 10.12998/wjcc.v8.i5.887
Published online Mar 6, 2020. doi: 10.12998/wjcc.v8.i5.887
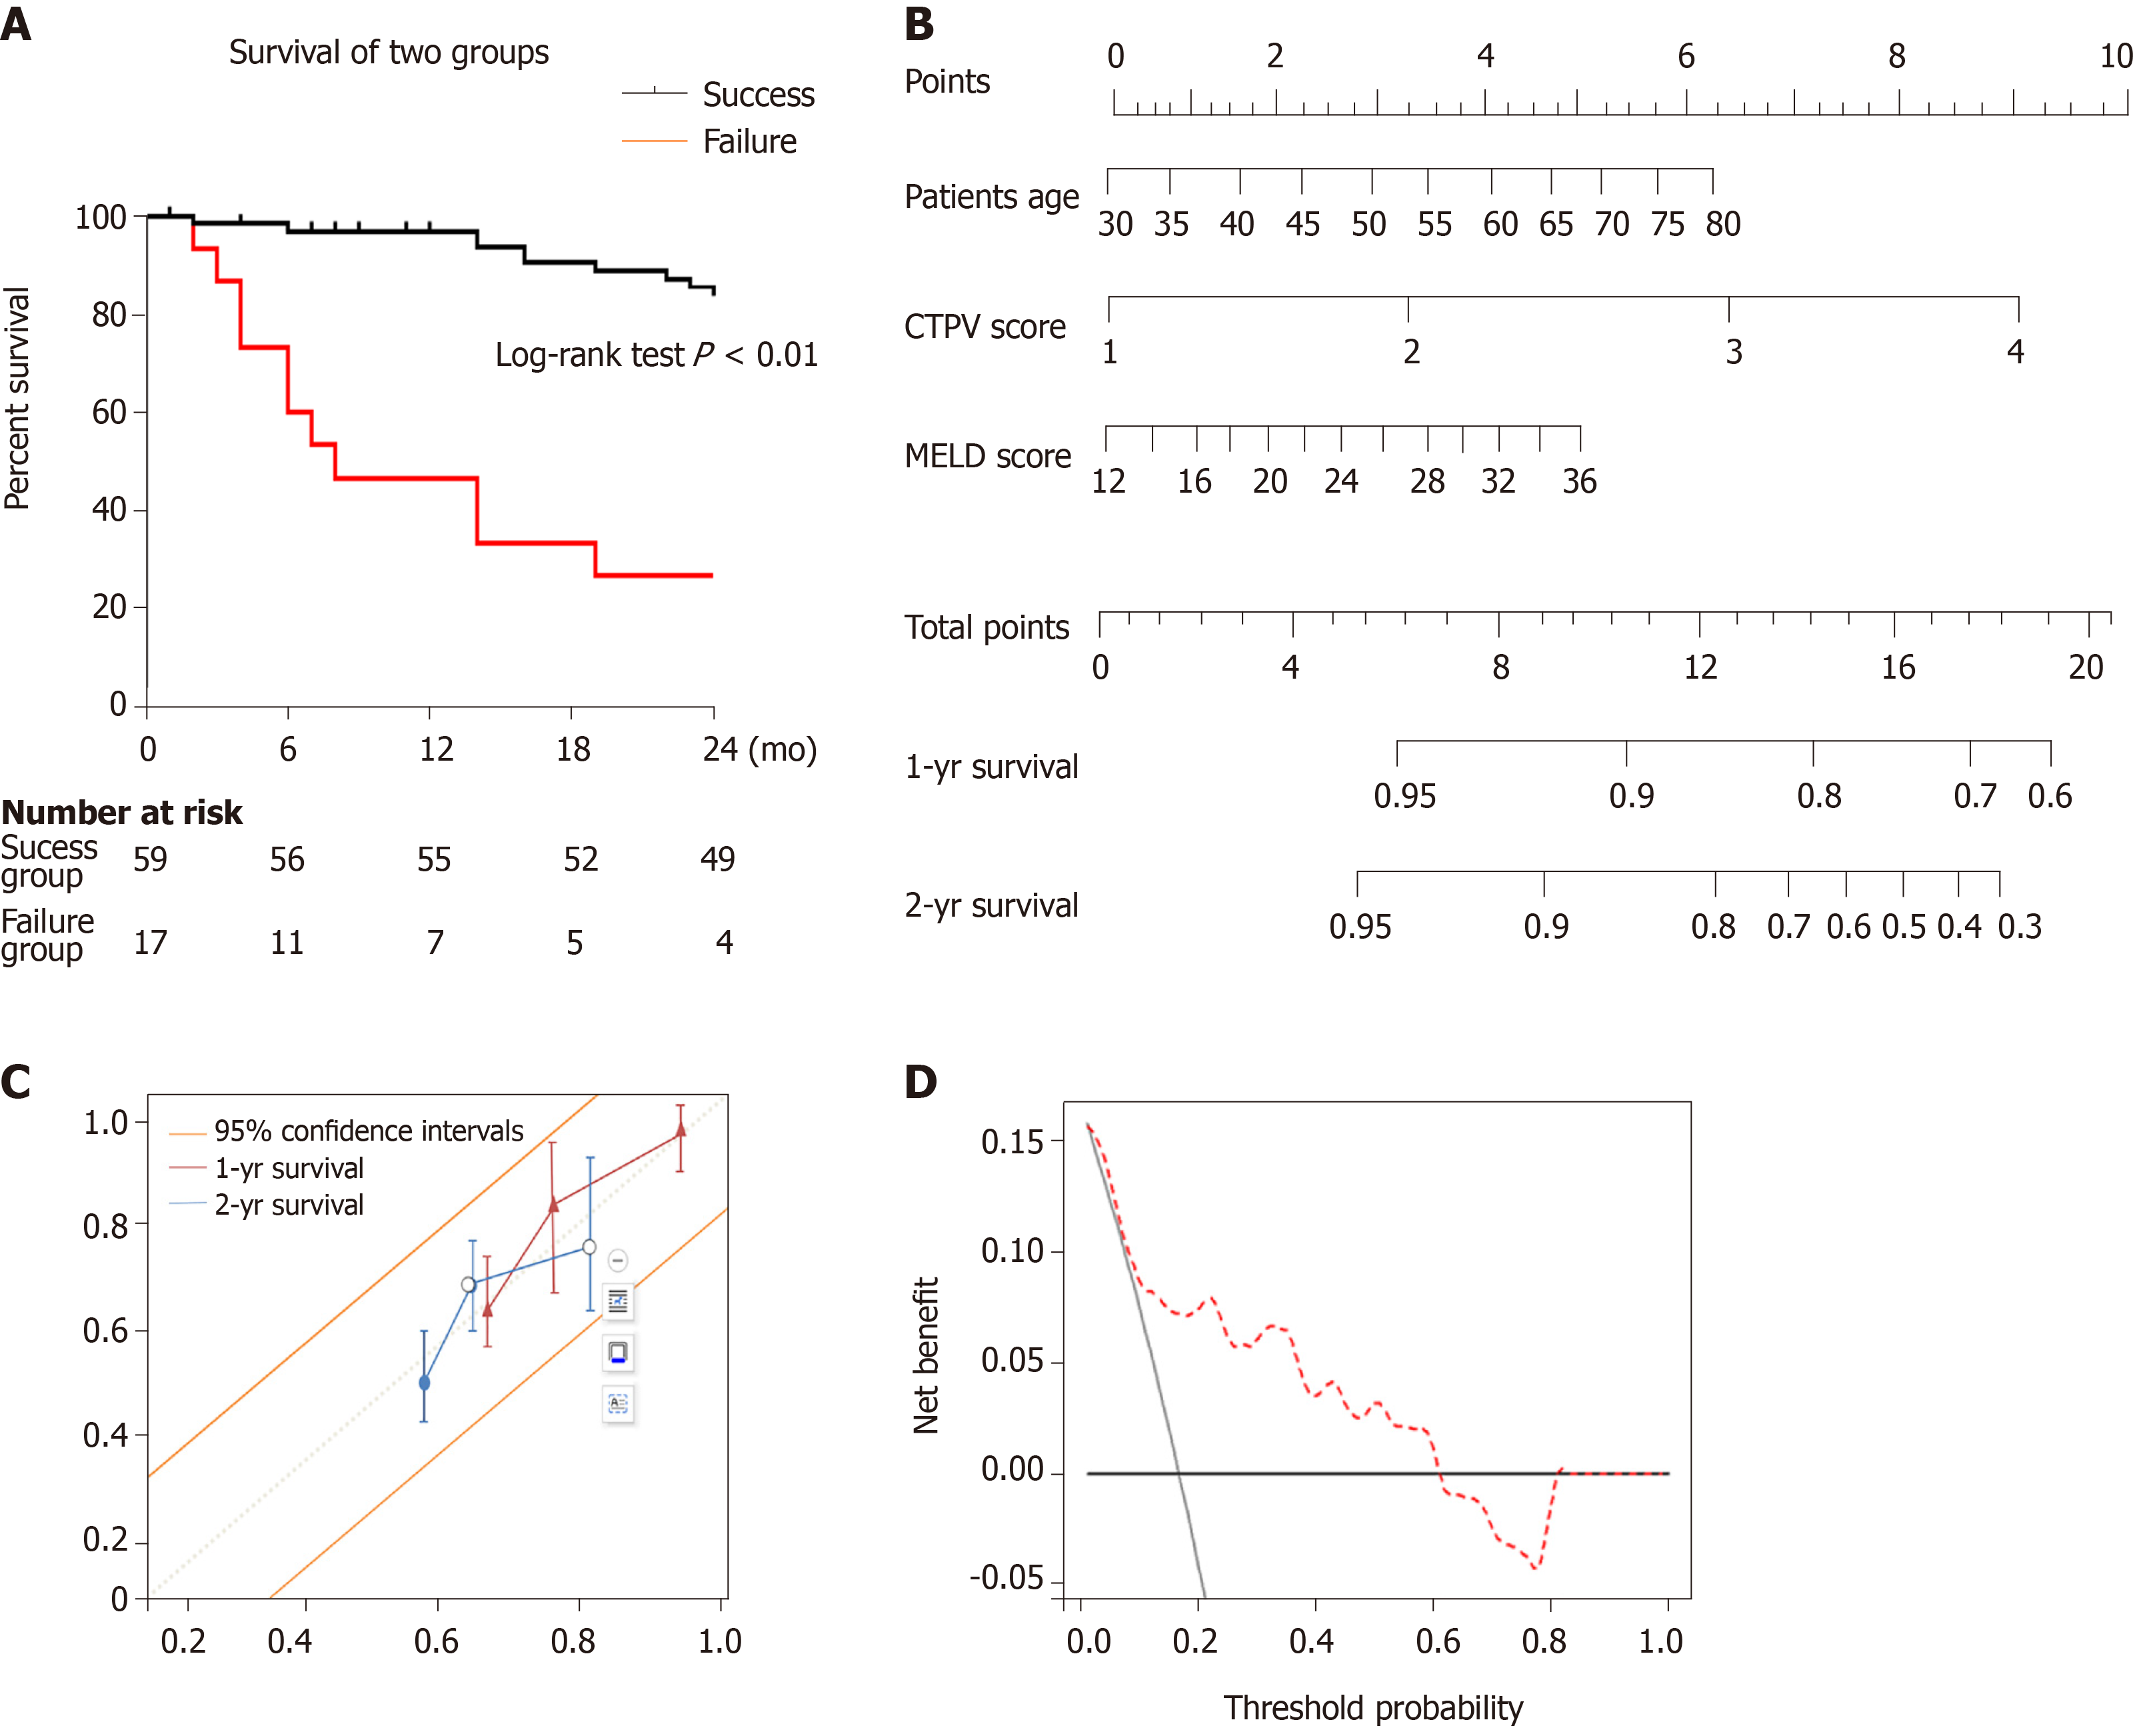
Figure 5 Survival.
A: Kaplan–Meier analysis of patient survival between transjugular intrahepatic portosystemic shunt (TIPS) success and failure groups; B: Nomogram predicting 1- and 2-year survival after TIPS creation on patients with cavernous transformation of the portal vein. The nomogram was used by adding up the points identified on the points scale for each variable. To use the nomogram, first, the position of each variable on the corresponding axis should be found. Next, a line to the points axis for the number of points should be drawn. Then, the points from all the variables should be added. Finally, a line from the total points axis should be drawn to determine the 1- and 2-year overall survival probabilities at the lower line of the nomogram; C: Calibration curves for the clinical nomogram. Calibration of the clinical nomogram was based on the correspondence between the predicted and observed outcomes at 1 year and 2 years. Diagonal dotted line (a perfect estimation by an ideal model, in which the estimated outcome perfectly corresponds to the actual outcome), solid line (performance of the nomogram); D: Decision curve analysis for the nomogram. The decision curve analysis indicated that if the threshold probability is within a range from 0.01 to 0.61, more net benefit is added by using the nomogram for selecting patient who would benefit from TIPS. CTPV: Cavernous transformation of the portal vein; MELD: Model of end-stage liver disease.
- Citation: Niu XK, Das SK, Wu HL, Chen Y. Computed tomography-based score model/nomogram for predicting technical and midterm outcomes in transjugular intrahepatic portosystemic shunt treatment for symptomatic portal cavernoma. World J Clin Cases 2020; 8(5): 887-899
- URL: https://www.wjgnet.com/2307-8960/full/v8/i5/887.htm
- DOI: https://dx.doi.org/10.12998/wjcc.v8.i5.887


