Copyright
©The Author(s) 2020.
World J Clin Cases. Mar 6, 2020; 8(5): 887-899
Published online Mar 6, 2020. doi: 10.12998/wjcc.v8.i5.887
Published online Mar 6, 2020. doi: 10.12998/wjcc.v8.i5.887
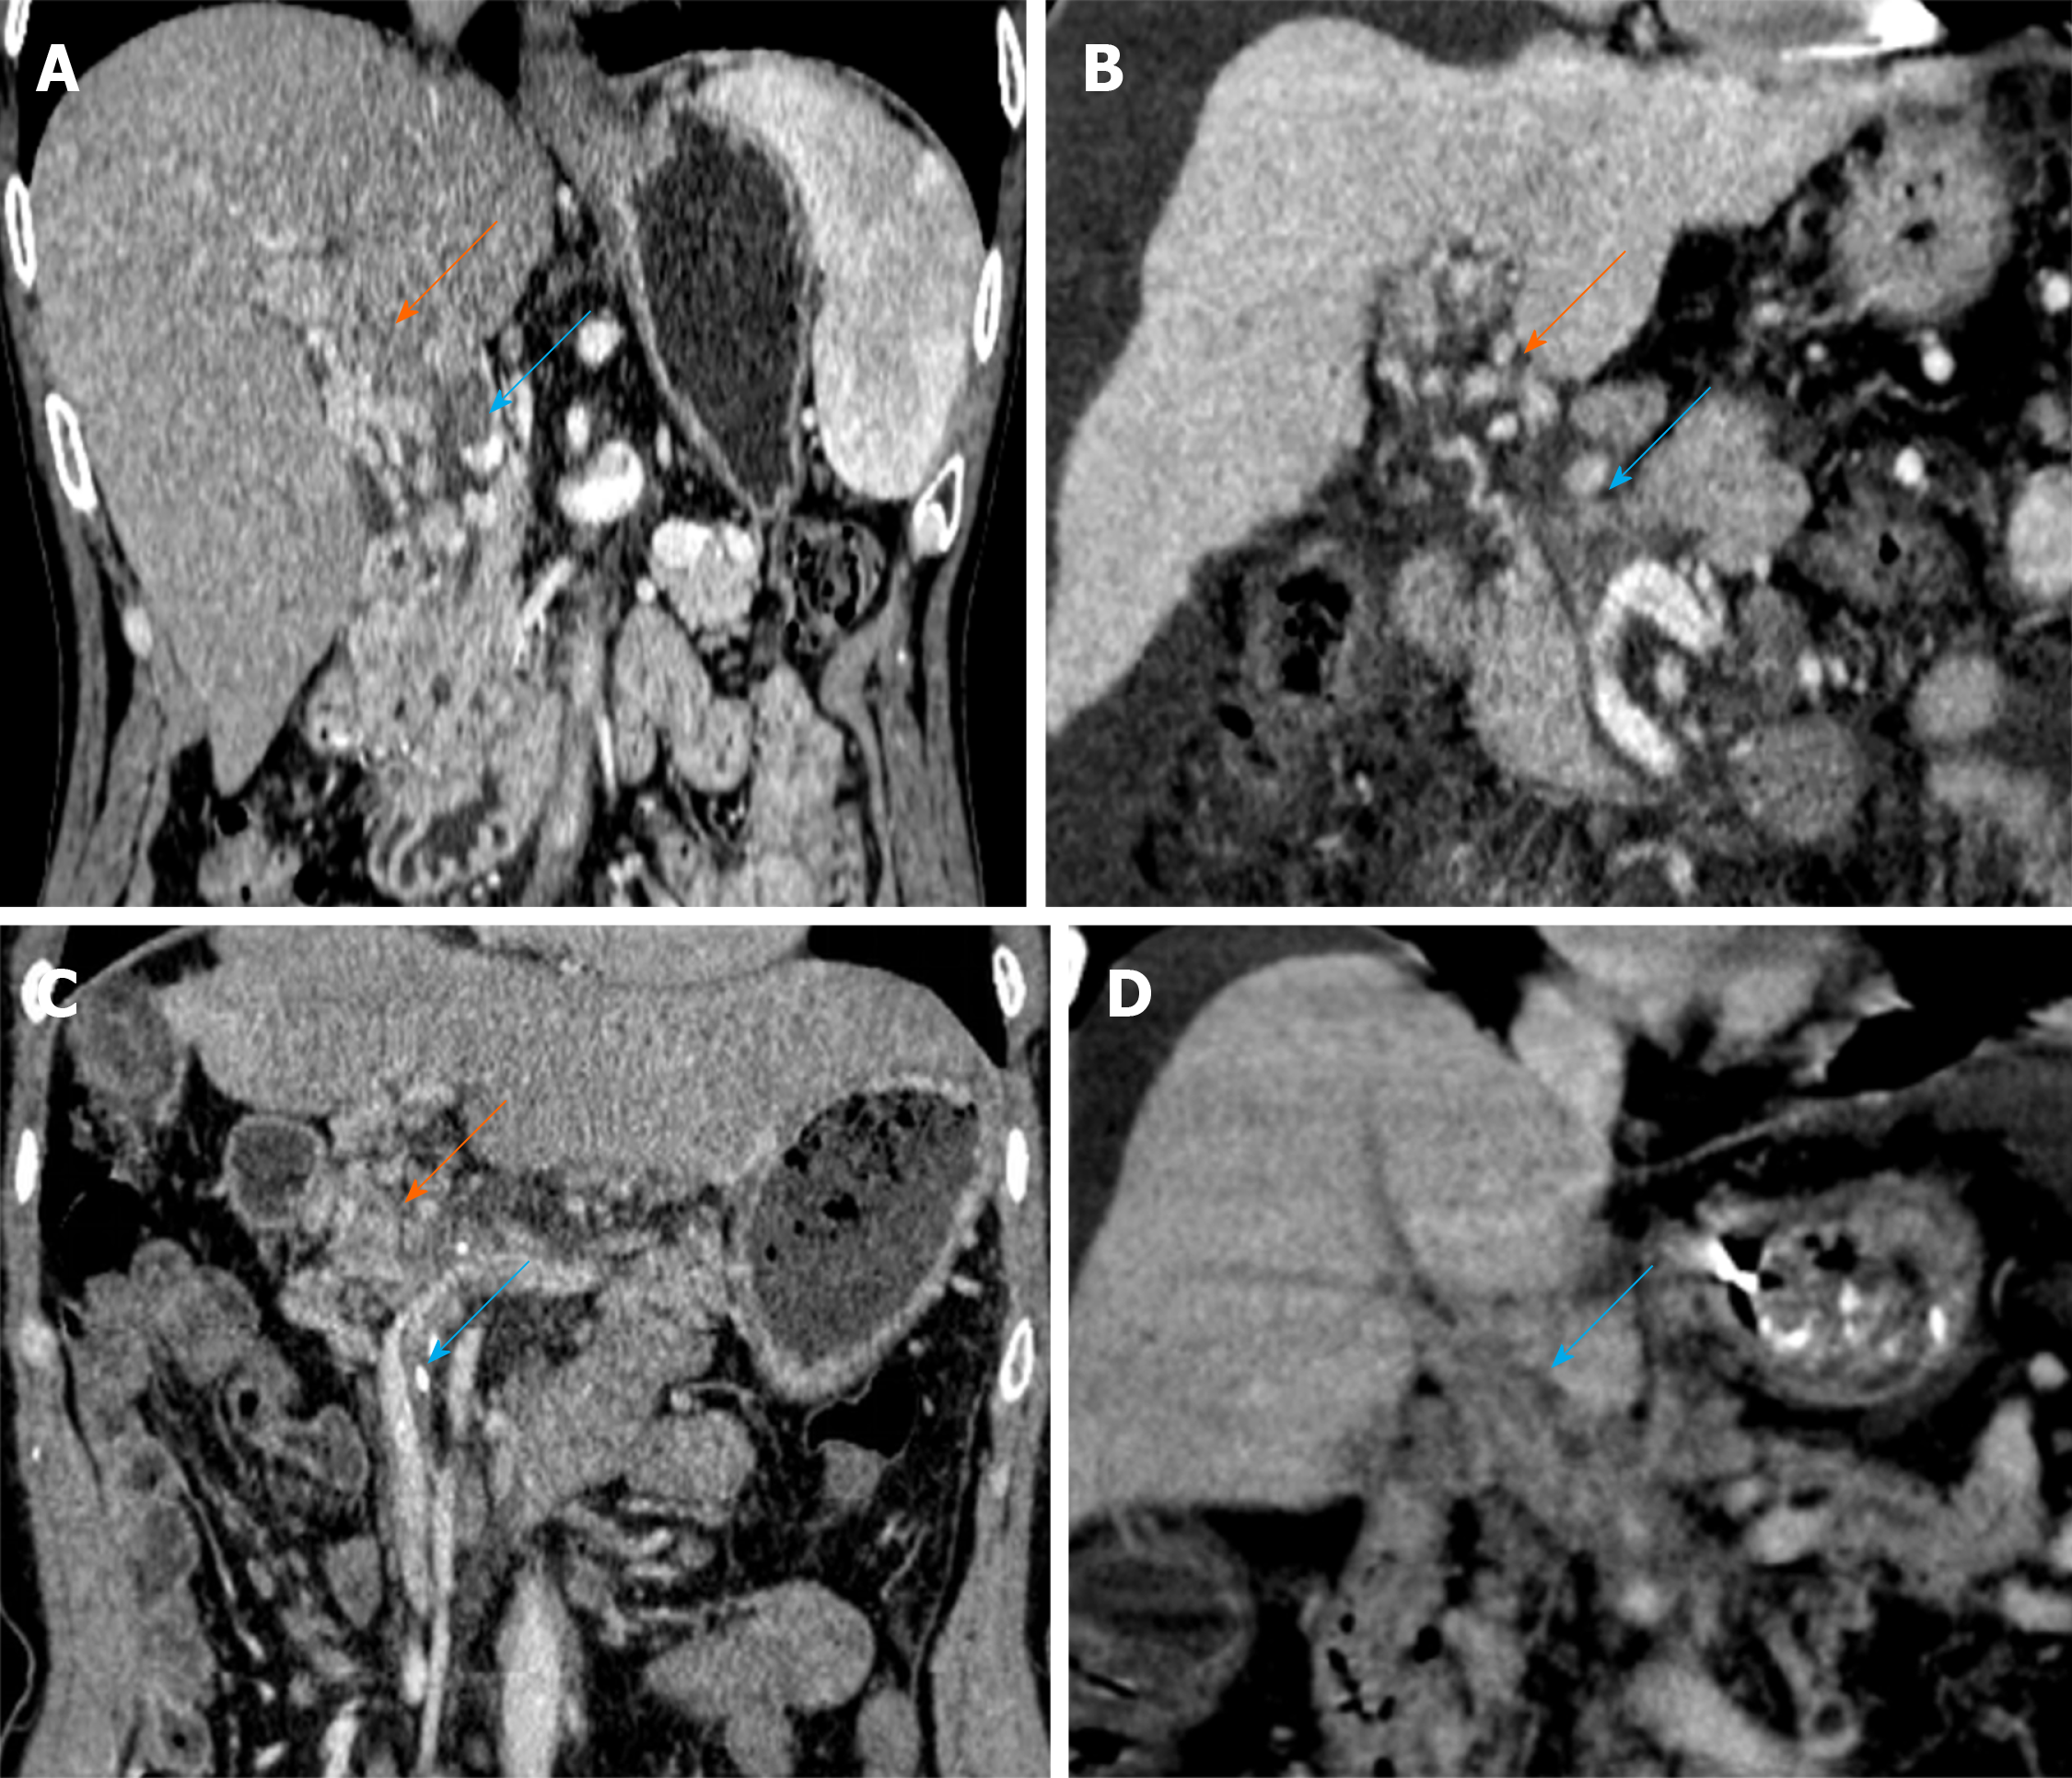
Figure 1 Scoring system to characterize cavernous transformation of the portal vein.
A: Portal cavernoma with a score of 1. Contrast-enhanced coronal portal venous phase computed tomography (CT) image before transjugular intrahepatic portosystemic shunt creation displays partial thrombosis of the main portal vein (PV) (blue arrow) and portal cavernoma (orange arrow); B: Portal cavernoma with a score of 2. Enhanced CT image shows complete thrombosis of the main PV (blue arrow) and portal cavernoma (orange arrow); C: Portal cavernoma with a score of 3. CT image shows complete thrombosis of the main PV plus thrombosis of superior mesenteric vein (blue arrow) and portal cavernoma (orange arrow); D: Portal cavernoma with a score of 4. CT image shows complete nonvisualization of the main PV (blue arrow).
- Citation: Niu XK, Das SK, Wu HL, Chen Y. Computed tomography-based score model/nomogram for predicting technical and midterm outcomes in transjugular intrahepatic portosystemic shunt treatment for symptomatic portal cavernoma. World J Clin Cases 2020; 8(5): 887-899
- URL: https://www.wjgnet.com/2307-8960/full/v8/i5/887.htm
- DOI: https://dx.doi.org/10.12998/wjcc.v8.i5.887


