Copyright
©The Author(s) 2020.
World J Clin Cases. Feb 26, 2020; 8(4): 848-853
Published online Feb 26, 2020. doi: 10.12998/wjcc.v8.i4.848
Published online Feb 26, 2020. doi: 10.12998/wjcc.v8.i4.848
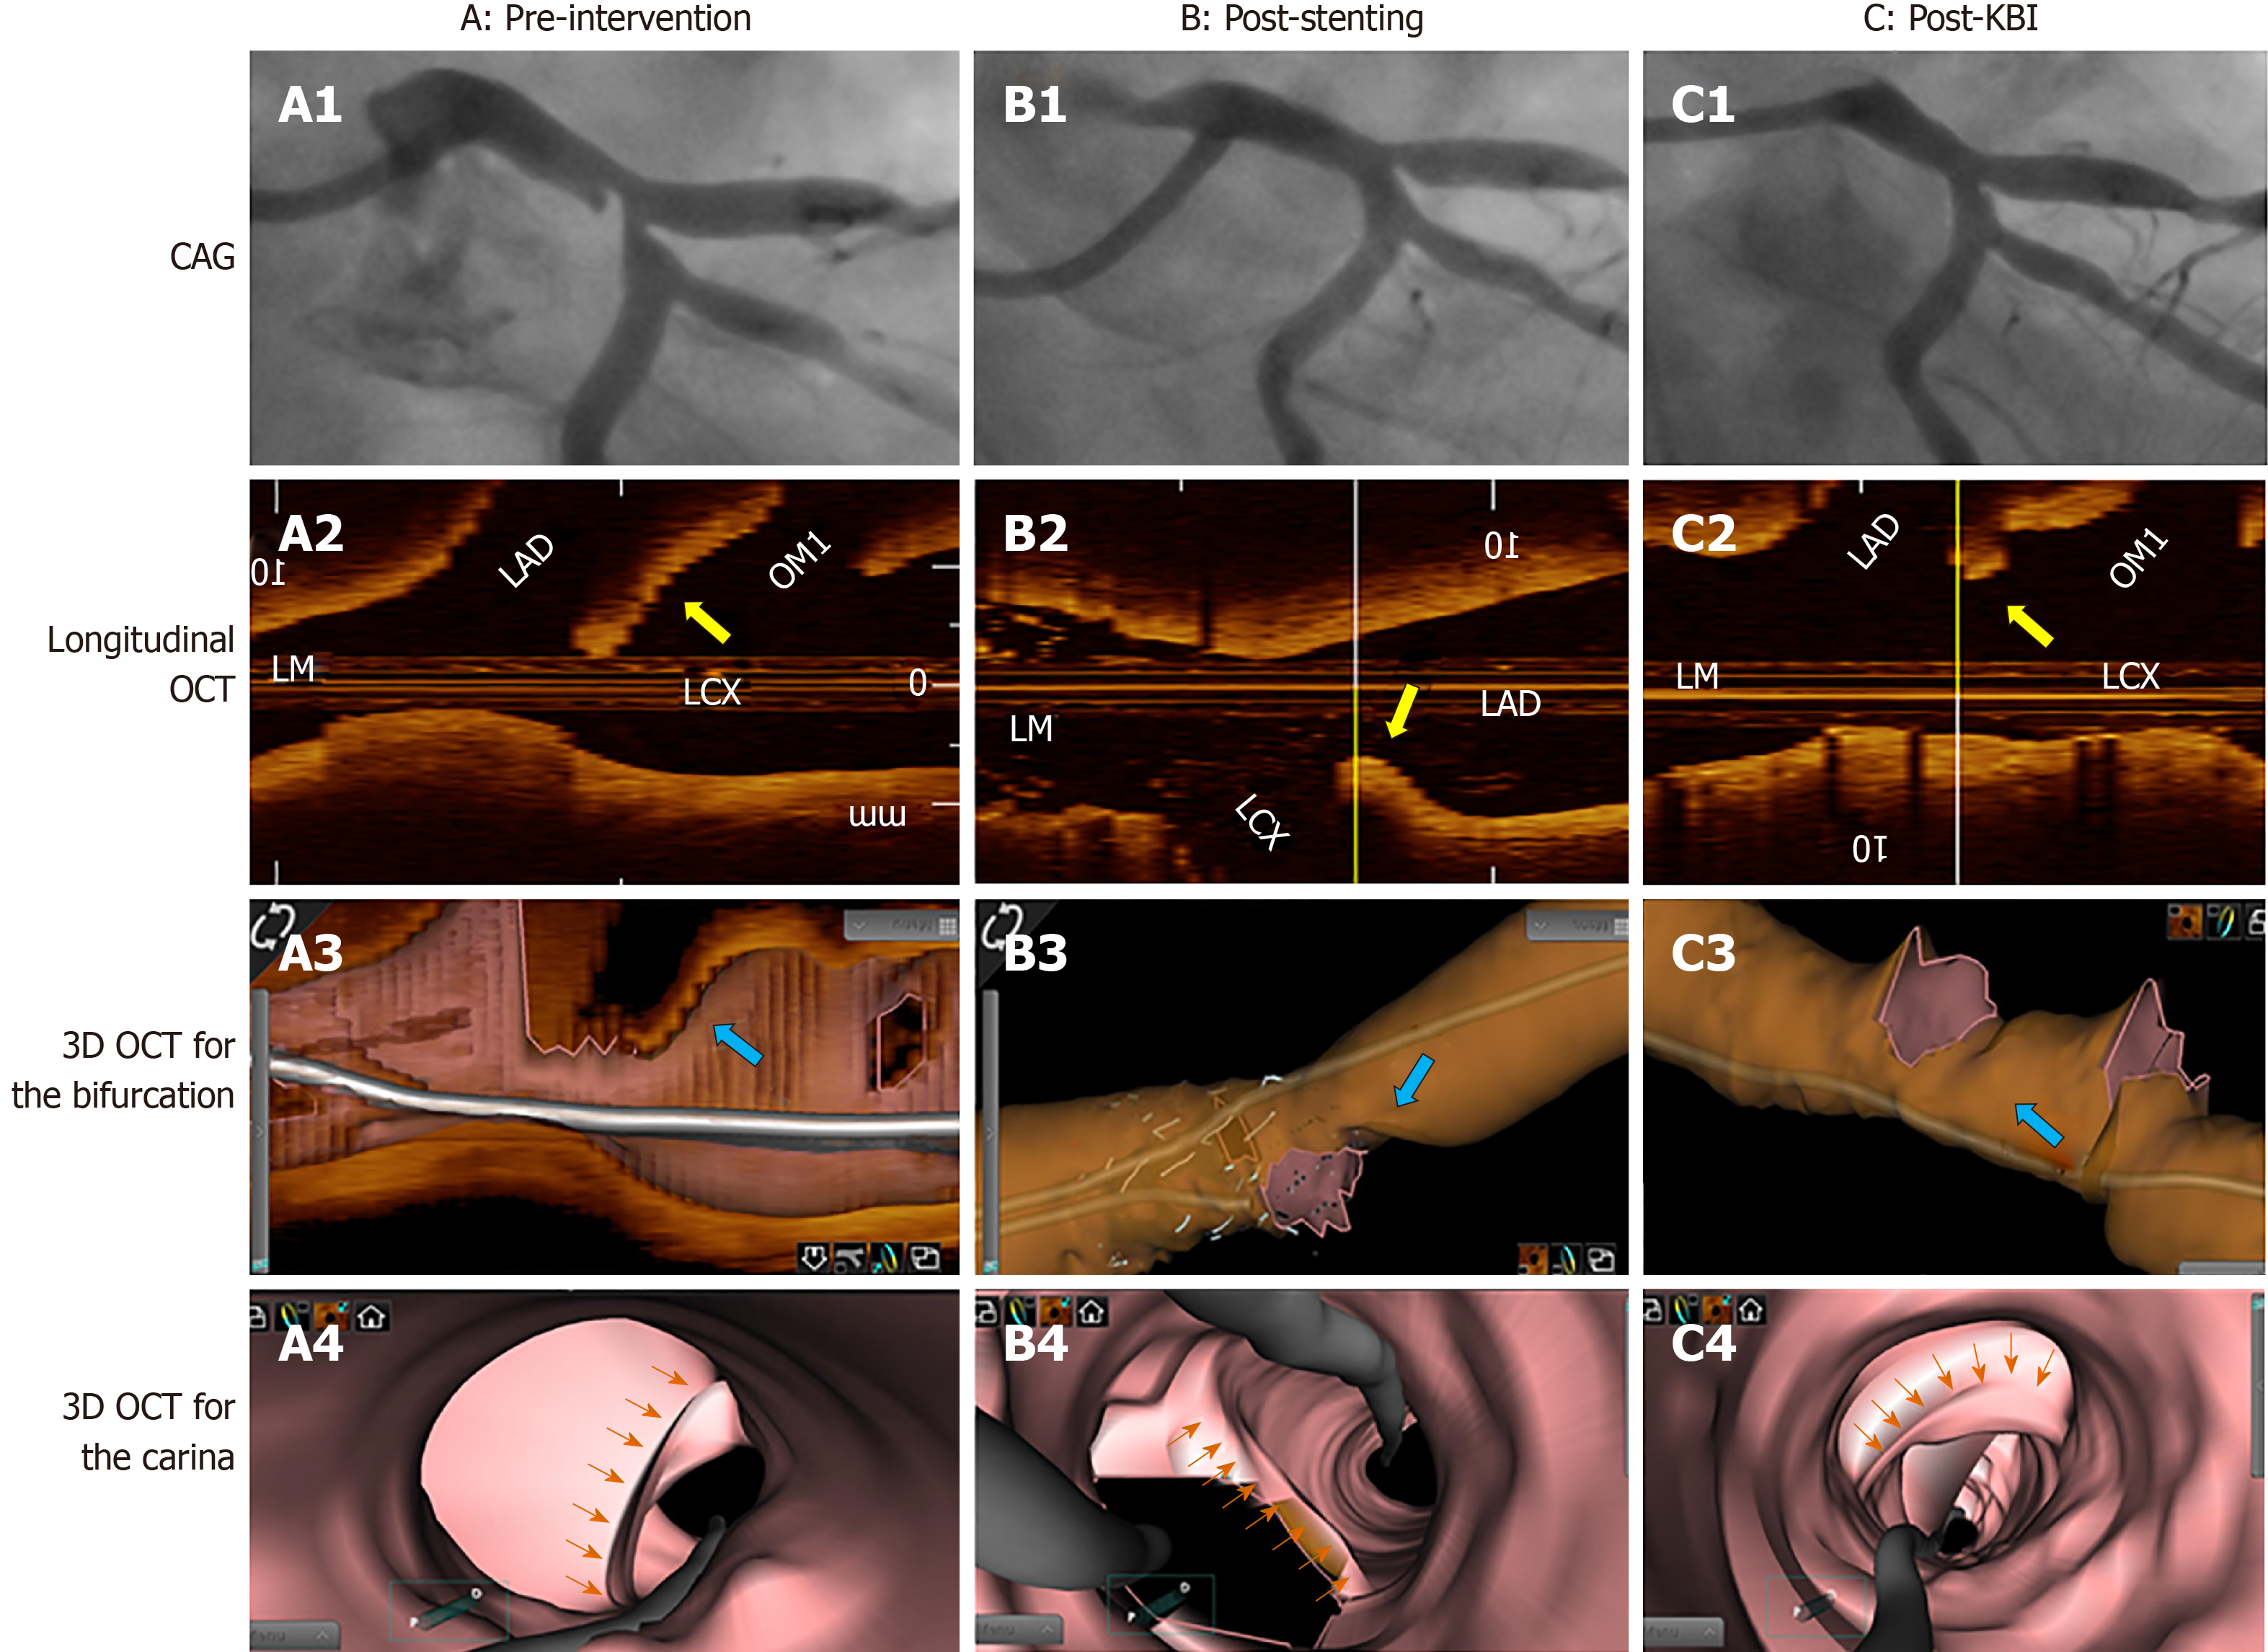
Figure 2 Angiography, longitudinal optical coherence tomography, and 3D reconstruction images of the bifurcation and displacement of the carina at different stages of the procedure.
A: Pre-intervention images; B: Post-stenting images; C: Post-kissing balloon inflation images. A1, B1, C1: Coronary angiography (CAG) images of the carina shift during the procedure. A2, B2, C2: Longitudinal optical coherence tomography (OCT) images of carina deviation during the procedure. Yellow arrow indicates the carina. The images were adjusted in the same direction with CAG. A3, B3, C3: 3D-OCT images of the carina shift during the procedure. Blue arrow indicates the carina. A4, B4, C4: 3D-OCT images of the carina from an intracoronary view during the procedure. Orange arrows in A4 and B4 indicate the carina shift. Orange arrows in C4 indicate tissue protrusion. CAG: coronary angiography, OCT: optical coherence tomography.
- Citation: Du BB, Tong YL, Wang XT, Liu GH, Liu K, Yang P, He YQ. Rescue treatment and follow-up intervention of a left main acute myocardial infarction with typical carina shift under 3D optical coherence tomography: A case report. World J Clin Cases 2020; 8(4): 848-853
- URL: https://www.wjgnet.com/2307-8960/full/v8/i4/848.htm
- DOI: https://dx.doi.org/10.12998/wjcc.v8.i4.848


