Copyright
©The Author(s) 2020.
World J Clin Cases. Feb 26, 2020; 8(4): 658-669
Published online Feb 26, 2020. doi: 10.12998/wjcc.v8.i4.658
Published online Feb 26, 2020. doi: 10.12998/wjcc.v8.i4.658
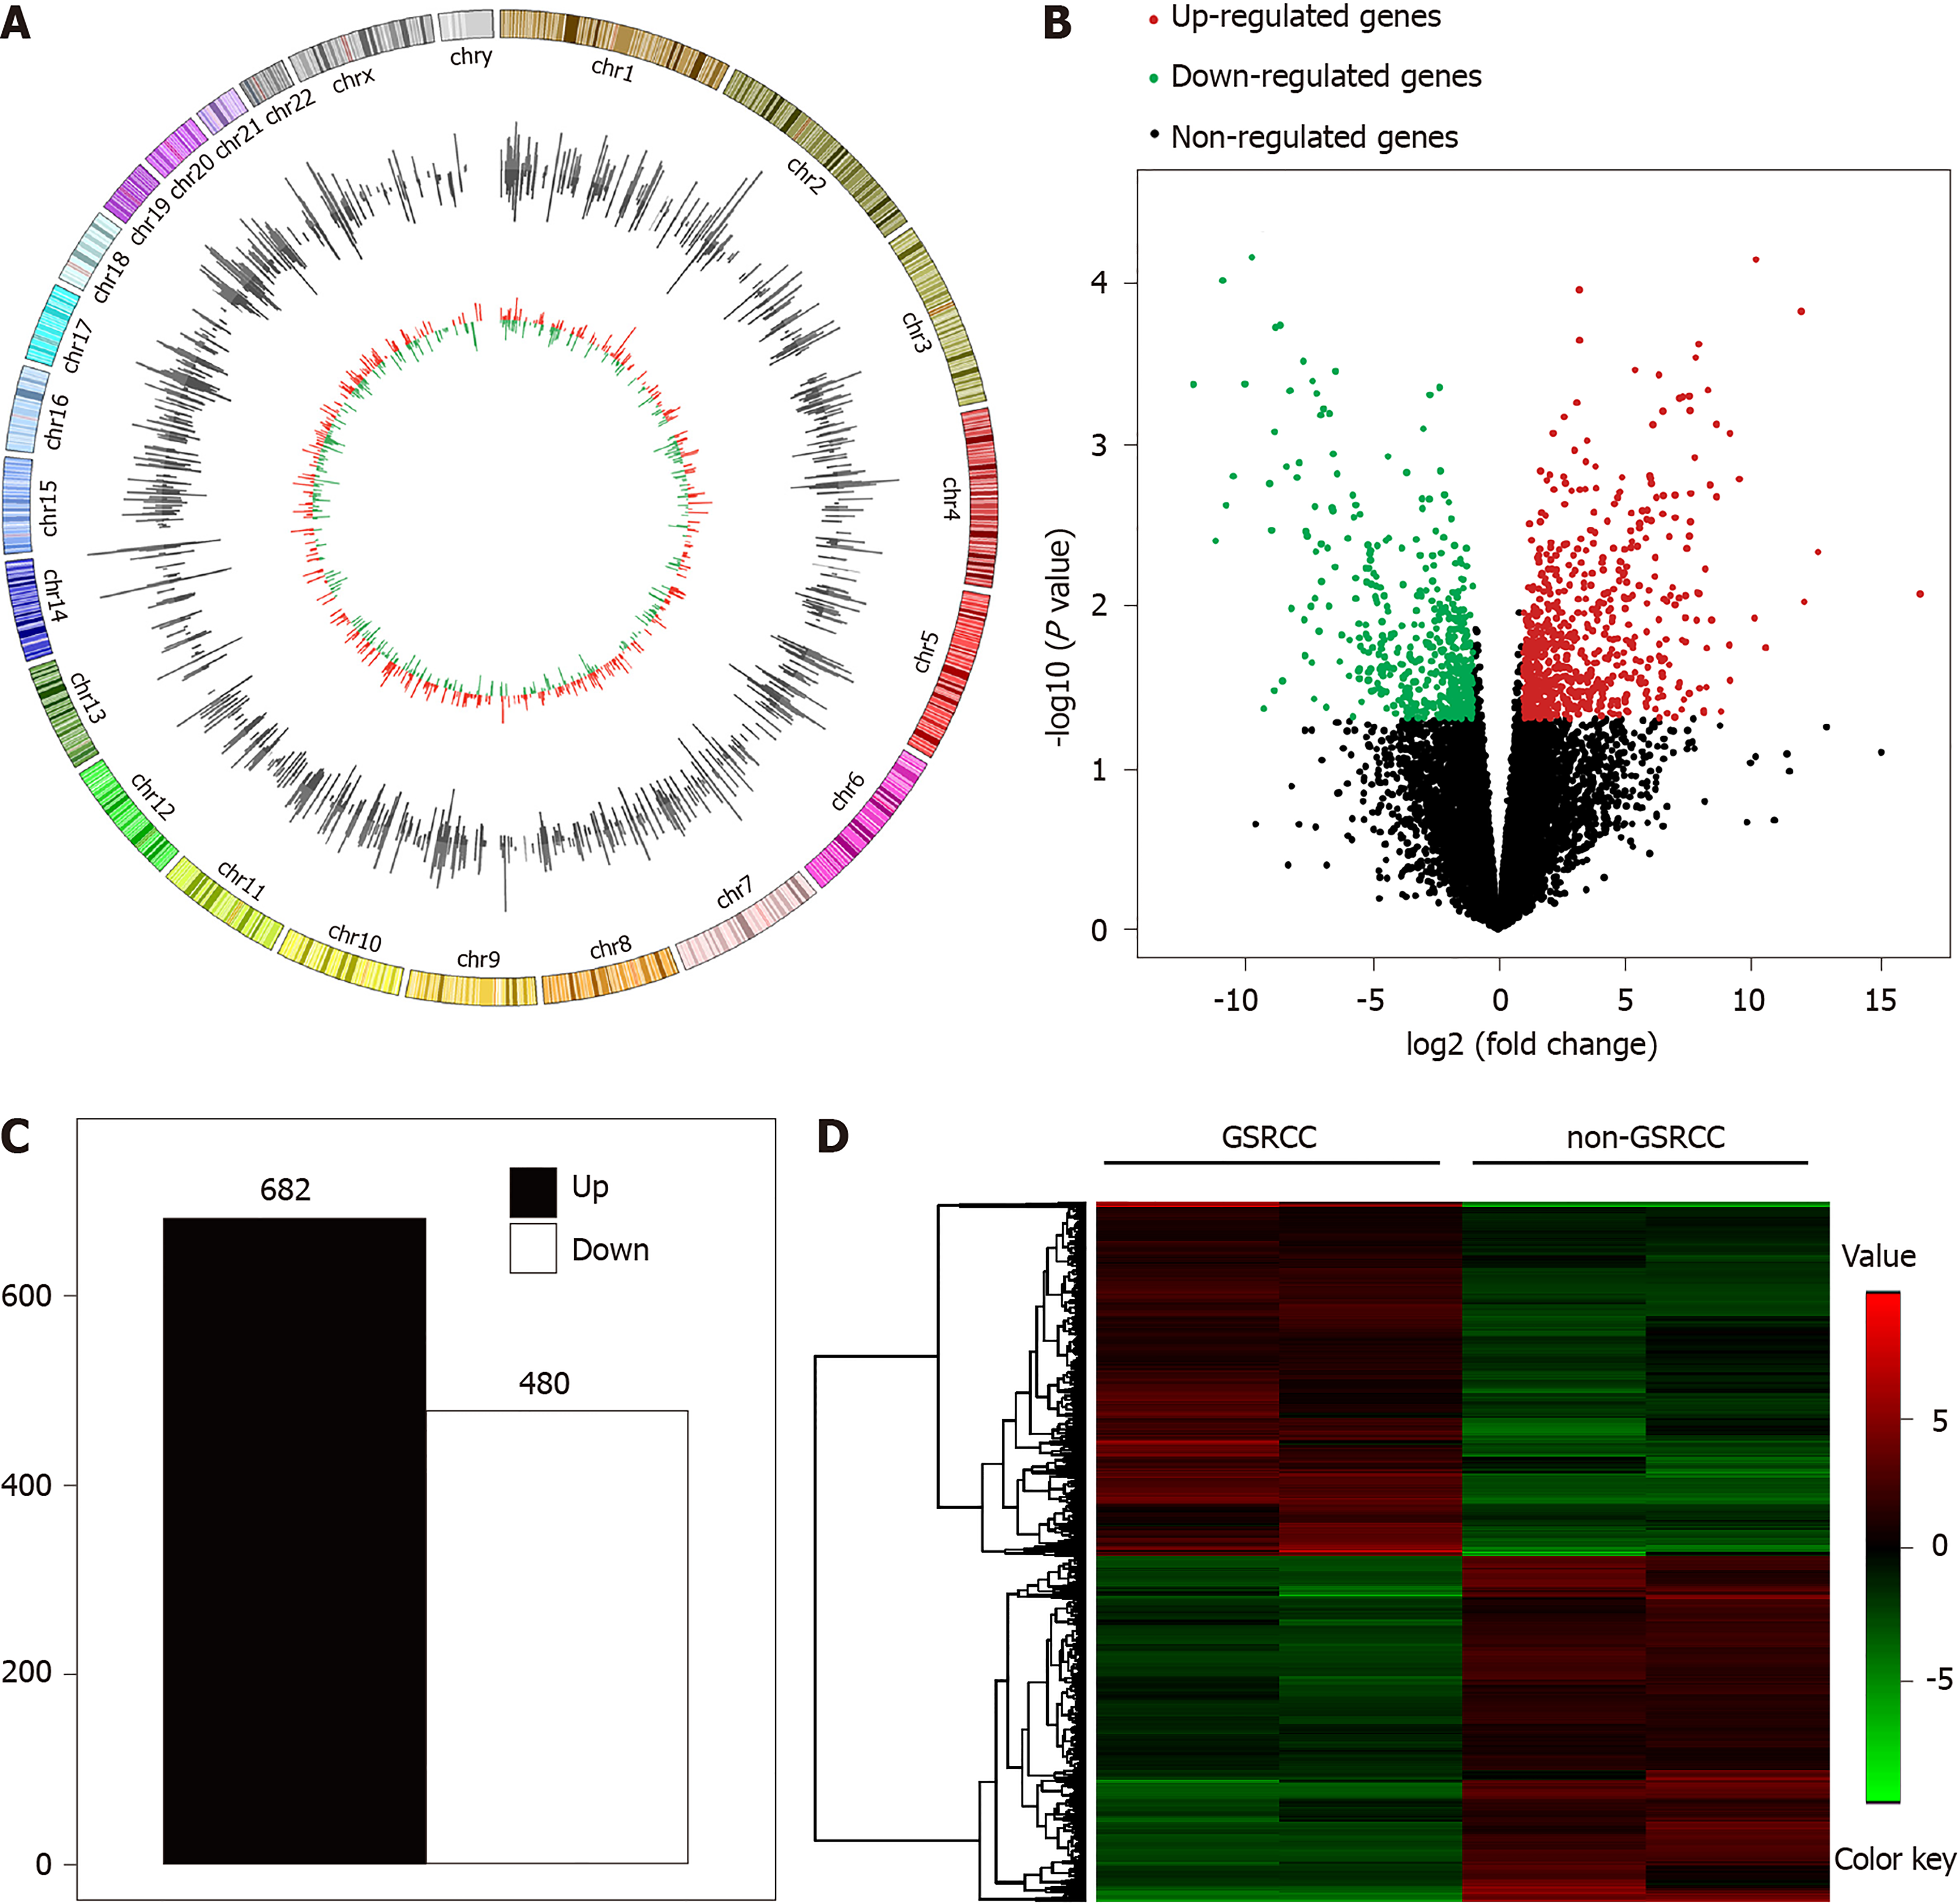
Figure 1 Summary of transcriptome sequencing results of mRNA expression in gastric carcinoma.
A: Circos plot shows the differential genes on the human chromosomes. From the outside and inwards, the first layer of the Circos plot is a chromosome map of the human genome; the black and white bars represent expression, while the third layer of circus plot represents differential genes, red indicates up-regulated genes, and green indicates down-regulated genes; B: Volcano plot of the distributions of mRNAs; C: Numbers of differential genes between gastric signet ring cell carcinoma and non-gastric signet ring cell carcinoma; D: Cluster analysis of functional mRNAs in four cases of gastric carcinoma, and data are presented as a heat map (P < 0.05). GSRCC: Gastric signet ring cell carcinoma.
- Citation: Zhao ZT, Li Y, Yuan HY, Ma FH, Song YM, Tian YT. Identification of key genes and pathways in gastric signet ring cell carcinoma based on transcriptome analysis. World J Clin Cases 2020; 8(4): 658-669
- URL: https://www.wjgnet.com/2307-8960/full/v8/i4/658.htm
- DOI: https://dx.doi.org/10.12998/wjcc.v8.i4.658


