Copyright
©The Author(s) 2020.
World J Clin Cases. Dec 26, 2020; 8(24): 6456-6464
Published online Dec 26, 2020. doi: 10.12998/wjcc.v8.i24.6456
Published online Dec 26, 2020. doi: 10.12998/wjcc.v8.i24.6456
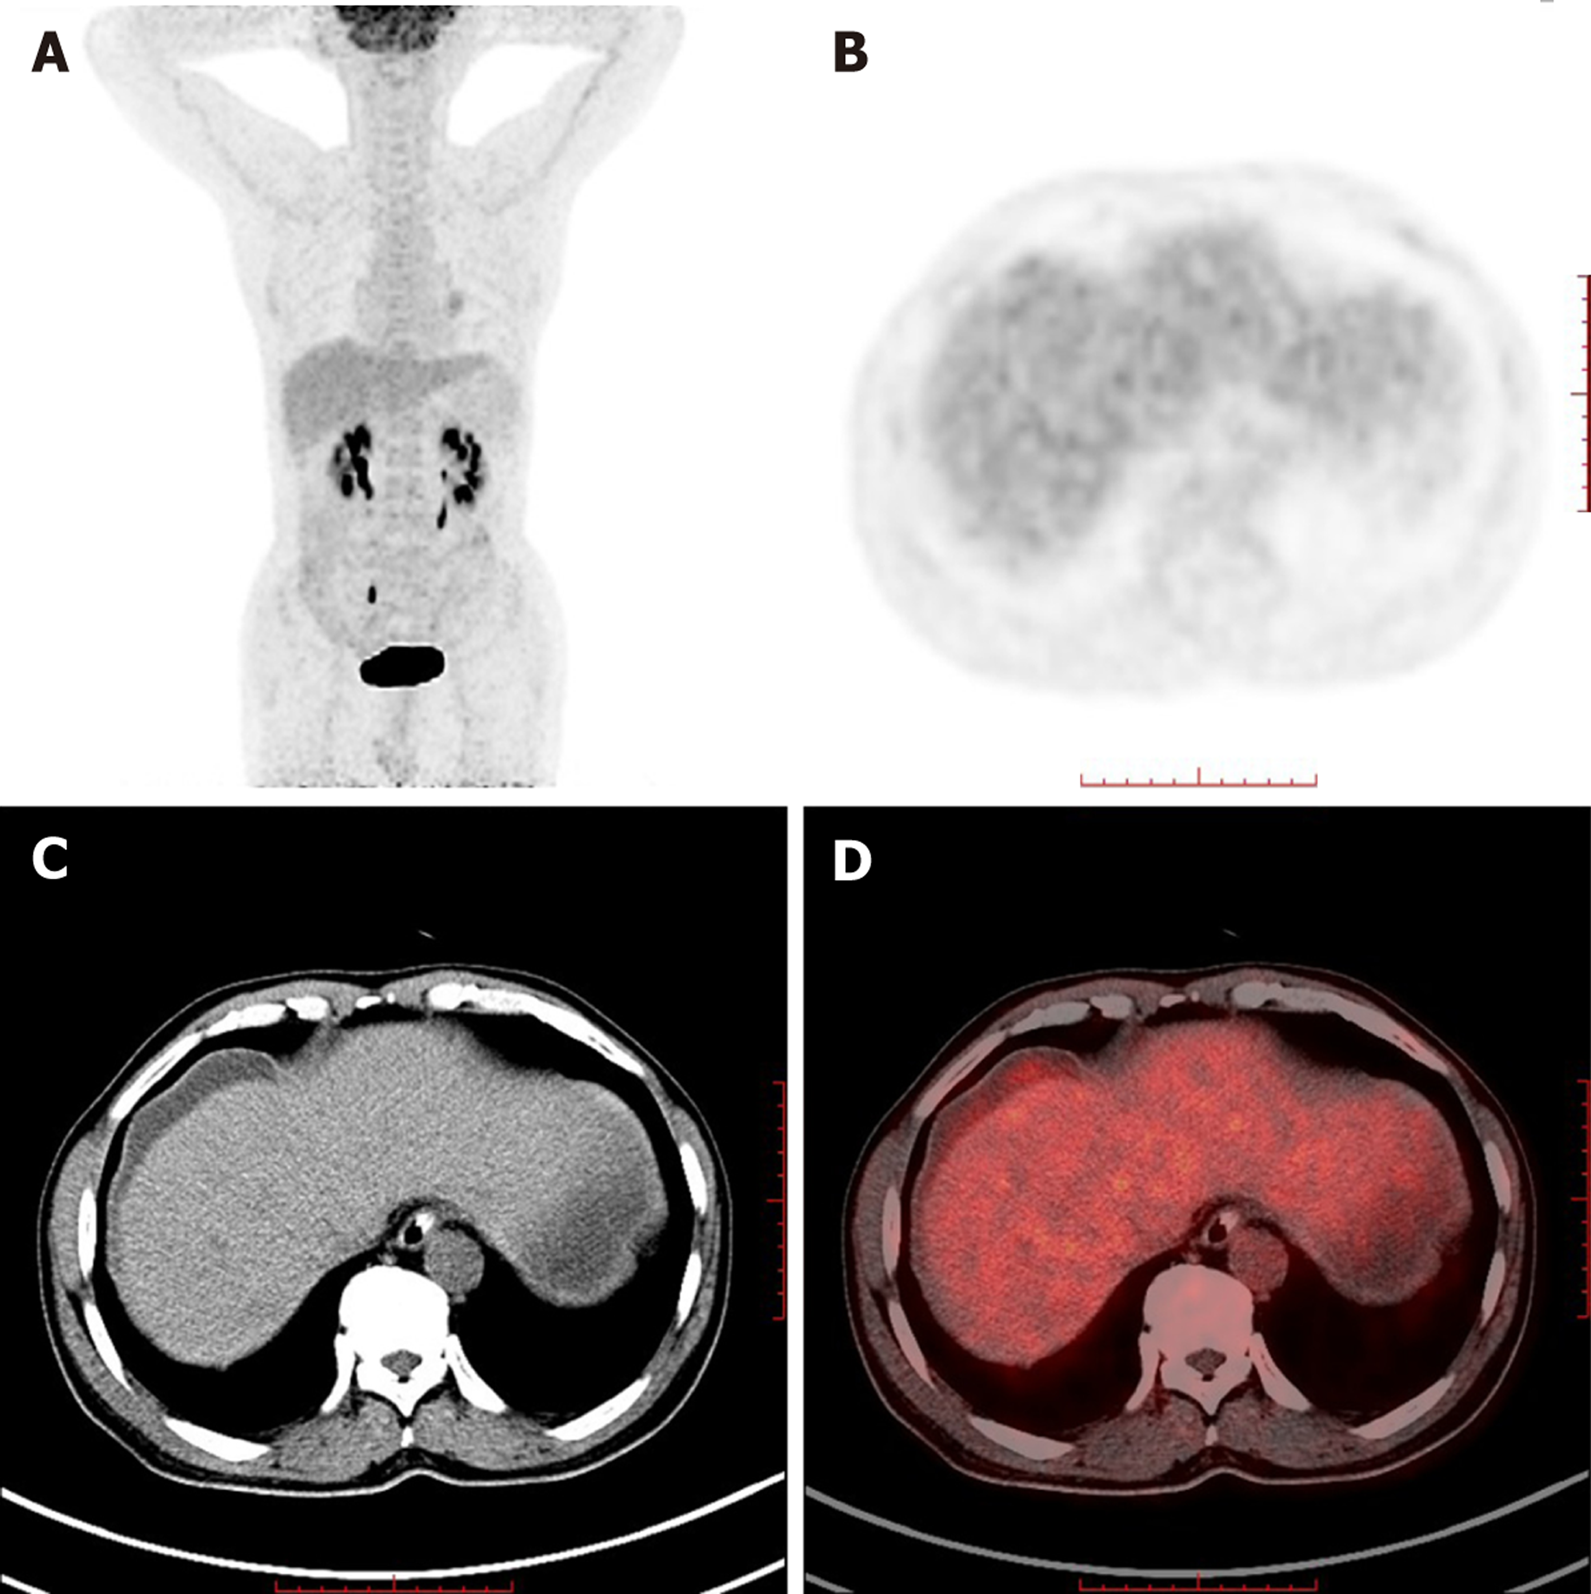
Figure 5 Whole-body maximum intensity projection 18F-fluorodeoxyglucose and positron emission tomography.
A: Slightly increased fluorodeoxyglucose metabolism in the subcapsular effusion of the liver, as well as in the right upper area of the peritoneum; B: Positron emission tomography; C: Computed tomography; D: Positron emission tomography/computed tomography in axial projection showing lesions in the subcapsular effusion of the liver.
- Citation: Li JJ, Chen BC, Dong J, Chen Y, Chen YW. Synchronous colonic mucosa-associated lymphoid tissue lymphoma found after surgery for adenocarcinoma: A case report and review of literature. World J Clin Cases 2020; 8(24): 6456-6464
- URL: https://www.wjgnet.com/2307-8960/full/v8/i24/6456.htm
- DOI: https://dx.doi.org/10.12998/wjcc.v8.i24.6456


