Copyright
©The Author(s) 2020.
World J Clin Cases. Dec 6, 2020; 8(23): 6071-6079
Published online Dec 6, 2020. doi: 10.12998/wjcc.v8.i23.6071
Published online Dec 6, 2020. doi: 10.12998/wjcc.v8.i23.6071
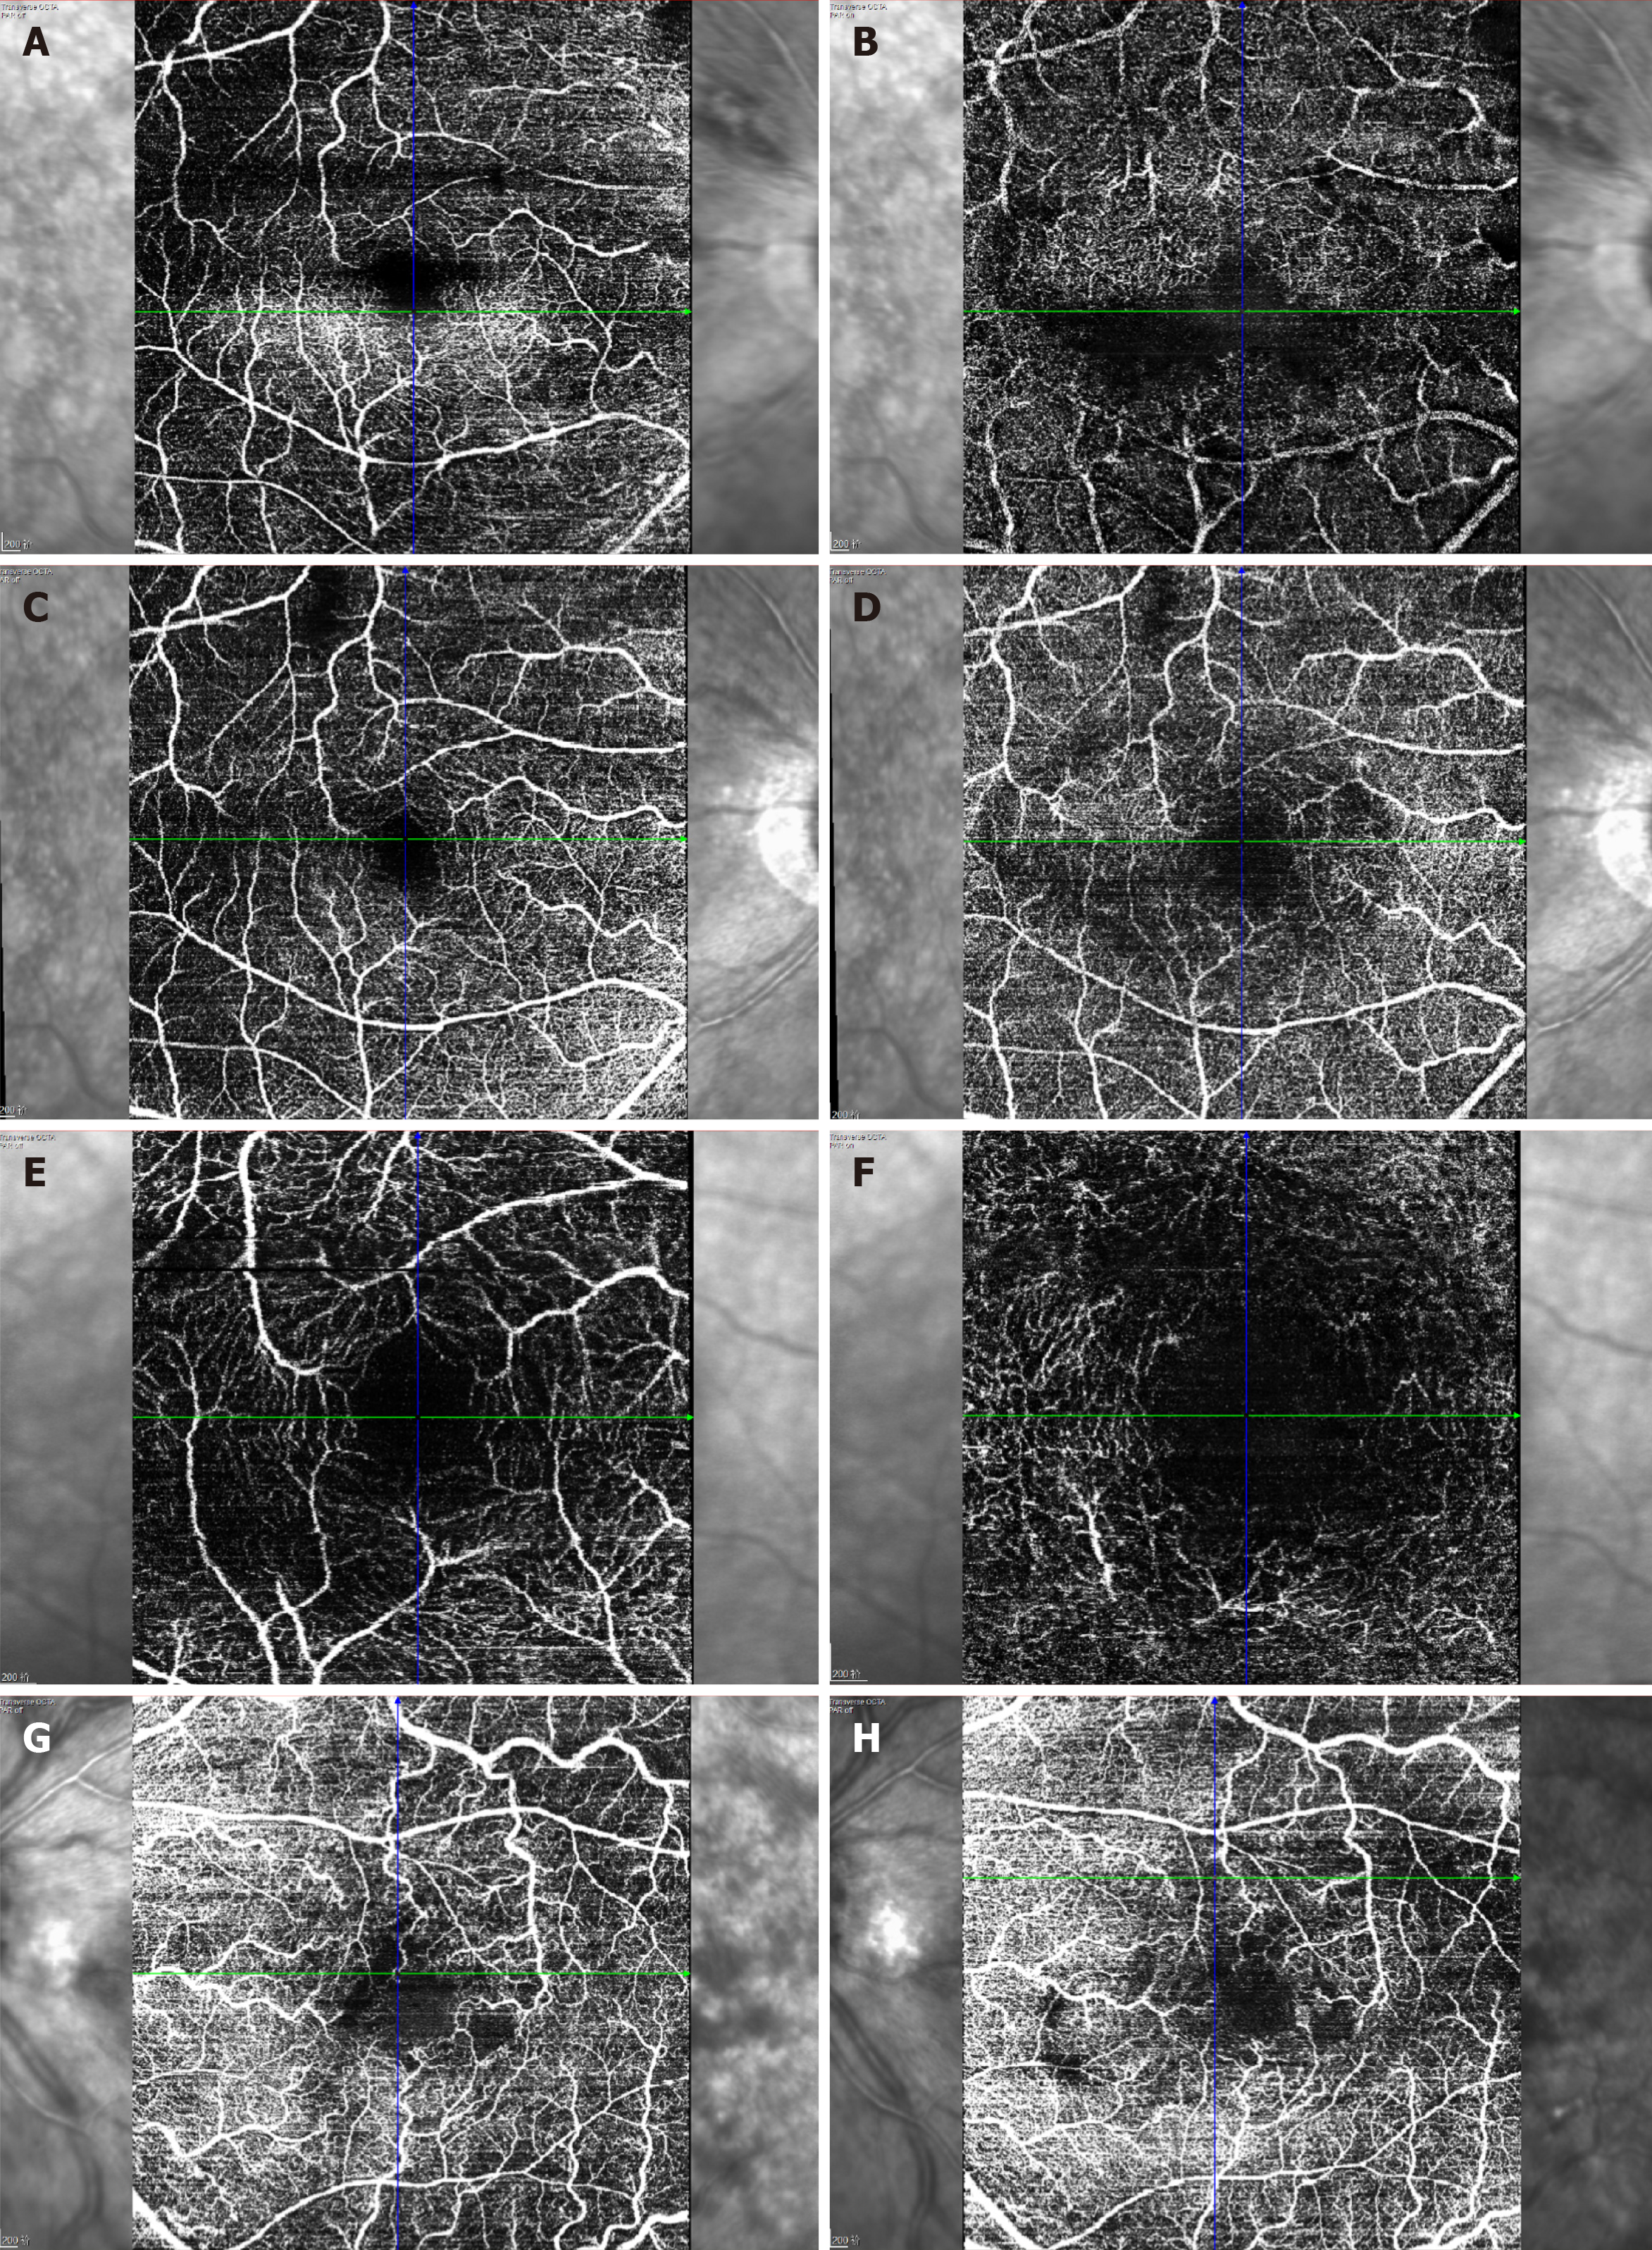
Figure 4 Transverse optical coherence tomography angiograms showing the disrupted retinal vasculature and intraretinal edema in both eyes and improvement after intravitreal ranibizumab.
A: Baseline superficial capillary plexus (internal limiting membrane to inner plexiform layer) (right eye); B: Baseline deep capillary plexus (inner plexiform layer to outer plexiform layer) (right eye); C: 1 mo after intravitreal ranibizumab (IVR) (superficial; right eye); D: 1 mo after IVR (deep; right eye); E: 6 mo after IVR (superficial; right eye); F: 6 mo after IVR (deep; right eye); G: Baseline (the whole sensory retina; left eye); H: 1 mo after IVR (the whole sensory retina; left eye).
- Citation: Li J, Zhang R, Gu F, Liu ZL, Sun P. Optical coherence tomography angiography characteristics in Waldenström macroglobulinemia retinopathy: A case report. World J Clin Cases 2020; 8(23): 6071-6079
- URL: https://www.wjgnet.com/2307-8960/full/v8/i23/6071.htm
- DOI: https://dx.doi.org/10.12998/wjcc.v8.i23.6071


